Title here
Summary here
Lesson 1’s Job ran with no resources: block at all - nothing told the scheduler how much CPU or memory cityflow-etl-job would need, and nothing stopped it from using every last byte on the node if it wanted to. That worked, on a quiet cluster with one Job at a time. It is not how anything runs in production, where dozens of pods share a handful of nodes and the scheduler has to make real placement decisions with real consequences if it gets them wrong. This lesson gives you the two numbers that make those decisions possible, and shows you, for real, what happens when a container crosses one of them.
By the end of this lesson, you will be able to:
OOMKilled, while a container exceeding its CPU limit gets throttled, not killed.Exit Code: 137 and Reason: OOMKilled from kubectl describe pod as a specific, actionable signal, not just “the container died.”A pod’s resources: block has up to four fields, in two pairs:
resources:
  requests:
    cpu: "250m"
    memory: "128Mi"
  limits:
    cpu: "500m"
    memory: "256Mi"
requests is what the scheduler reads. When a new pod needs a home, the scheduler looks at every node’s allocatable capacity minus what’s already requested by pods already running there, and only places the new pod on a node that has enough left over to honor its request. This is a promise made at placement time, before the container has run for even a second - the scheduler never measures actual usage to decide where something goes.
limits is what the kubelet and container runtime enforce once the container is actually running, on that node, moment to moment. A container is never allowed to exceed its limit - what happens when it tries depends entirely on which resource it’s trying to exceed, and that difference is the whole point of this lesson.
CPU and memory are fundamentally different kinds of resource, and Kubernetes treats them differently on purpose:
malloc() and resuming it later. So a memory limit is enforced by killing the container the instant it tries to exceed it: OOMKilled, exit code 137 (128 + signal 9, SIGKILL).That asymmetry - CPU throttles, memory kills - is not an implementation detail worth skimming past. It’s the reason a memory limit that’s too tight is far more dangerous in production than a CPU limit that’s too tight: a too-tight CPU limit makes a job slow; a too-tight memory limit makes it disappear.
Rather than a synthetic example, this lesson uses the real cityflow-etl-k8s:1.0 image Lesson 1 already ran - the genuine January 2024 zone-hour aggregation, run against a real 2,964,624-row file, under successively tighter memory limits, to find where it actually breaks:
for mem in 64m 80m 96m 112m 120m; do
  echo "=== memory=$mem ==="
  docker run --rm --memory="$mem" cityflow-etl-k8s:1.0
  echo "exit code: $?"
done
=== memory=64m ===
[cityflow-etl] starting - DB_HOST=(none - print only)
[cityflow-etl] using mounted data at /data/trips.parquet
exit code: 137
=== memory=80m ===
[cityflow-etl] starting - DB_HOST=(none - print only)
[cityflow-etl] using mounted data at /data/trips.parquet
exit code: 137
=== memory=96m ===
[cityflow-etl] starting - DB_HOST=(none - print only)
[cityflow-etl] using mounted data at /data/trips.parquet
exit code: 137
=== memory=112m ===
[cityflow-etl] starting - DB_HOST=(none - print only)
[cityflow-etl] using mounted data at /data/trips.parquet
exit code: 137
=== memory=120m ===
[cityflow-etl] CityFlow zone-hour ETL - January 2024 (Kubernetes)
[cityflow-etl] ---------------------------------------------------
[cityflow-etl] source rows (on disk): 2,964,624
[cityflow-etl] zone-hour buckets: 77,530
[cityflow-etl] trips kept: 2,964,606
[cityflow-etl] quarantined (out-of-window): 18
[cityflow-etl] total revenue: $79,455,941.50
[cityflow-etl] busiest zone-hour: zone 161 at 2024-01-24T18, 726 trips
[cityflow-etl] elapsed seconds: 1.18
[cityflow-etl] ETL completed successfully
exit code: 0A real, measured boundary: this exact job, on this exact real file, fails at every limit from 64 MiB through 112 MiB and succeeds at 120 MiB. Not a round number chosen for the lesson - the actual memory this actual pandas/pyarrow aggregation needs to hold the row-group buffers and the intermediate groupby result in memory at once.
apiVersion: batch/v1
kind: Job
metadata:
  name: cityflow-etl-oom
  namespace: cityflow
spec:
  backoffLimit: 0
  template:
    spec:
      restartPolicy: Never
      containers:
        - name: etl
          image: cityflow-etl-k8s:1.0
          imagePullPolicy: IfNotPresent
          resources:
            requests:
              cpu: "250m"
              memory: "64Mi"
            limits:
              cpu: "500m"
              memory: "64Mi"
backoffLimit: 0 is deliberate here - this Job is meant to fail once and stay failed, not retry into the identical wall three times.
kubectl apply -f job-oom.yaml
kubectl wait --for=condition=Failed job/cityflow-etl-oom -n cityflow --timeout=90s
kubectl get pods -n cityflow -l job-name=cityflow-etl-oom
kubectl describe pod -n cityflow -l job-name=cityflow-etl-oom
job.batch/cityflow-etl-oom created
job.batch/cityflow-etl-oom condition met
NAME READY STATUS RESTARTS AGE
cityflow-etl-oom-sfhmf 0/1 OOMKilled 0 11s State: Terminated
Reason: OOMKilled
Exit Code: 137
Started: Wed, 22 Jul 2026 13:35:25 +0330
Finished: Wed, 22 Jul 2026 13:35:30 +0330
Ready: False
Restart Count: 0STATUS: OOMKilled right in kubectl get pods, and kubectl describe pod spells out exactly why: Reason: Terminated, sub-reason OOMKilled, Exit Code: 137. This is Kubernetes surfacing the identical signal Module 3 Lesson 4 first taught you to read with docker inspect --format '{{.State.ExitCode}}' - the mechanism (a cgroup memory limit, the kernel’s OOM killer, SIGKILL) is exactly the same underneath Docker and Kubernetes, because Kubernetes’ container runtime is still enforcing the limit through the same Linux cgroups.
Give it the memory this job actually needs, with real headroom:
resources:
  requests:
    cpu: "250m"
    memory: "128Mi"
  limits:
    cpu: "500m"
    memory: "256Mi"
kubectl apply -f job-safe.yaml
kubectl wait --for=condition=Complete job/cityflow-etl-safe -n cityflow --timeout=90s
kubectl logs -n cityflow -l job-name=cityflow-etl-safe
kubectl get job cityflow-etl-safe -n cityflowjob.batch/cityflow-etl-safe created
job.batch/cityflow-etl-safe condition met
[cityflow-etl] CityFlow zone-hour ETL - January 2024 (Kubernetes)
[cityflow-etl] ---------------------------------------------------
[cityflow-etl] source rows (on disk): 2,964,624
[cityflow-etl] zone-hour buckets: 77,530
[cityflow-etl] trips kept: 2,964,606
[cityflow-etl] quarantined (out-of-window): 18
[cityflow-etl] total revenue: $79,455,941.50
[cityflow-etl] busiest zone-hour: zone 161 at 2024-01-24T18, 726 trips
[cityflow-etl] elapsed seconds: 5.78
[cityflow-etl] ETL completed successfully
NAME STATUS COMPLETIONS DURATION AGE
cityflow-etl-safe Complete 1/1 9s 9sSame image, same real January data, same real numbers - 128Mi request and 256Mi limit is enough real headroom above the ~120Mi boundary this section measured, and the Job completes cleanly.
requests without limits is a real, common mistake
A pod with requests.memory set but no limits.memory can still use unbounded memory on the node once running - the scheduler used the request to decide where to place it, but nothing then stops it from growing past that number and starving every other pod on the same node. Setting a request without a matching limit is a common, silent way to get exactly the “one bad pod ruins the whole node” failure Kubernetes’ resource model exists to prevent.
A small, genuinely CPU-bound task - counting primes below 1,500,000 by real trial division, deliberately not vectorized - run once with a generous CPU limit and once with a tight one:
"""CityFlow's zone-count workload - a small, real CPU-bound task used to
measure real Kubernetes CPU-limit throttling."""
import time


def is_prime(n):
    if n < 2:
        return False
    i = 2
    while i * i <= n:
        if n % i == 0:
            return False
        i += 1
    return True


start = time.time()
n = 1_500_000
count = sum(1 for x in range(n) if is_prime(x))
elapsed = time.time() - start
print(f"[cpu-work] primes below {n:,}: {count:,}")
print(f"[cpu-work] elapsed seconds: {elapsed:.2f}")apiVersion: batch/v1
kind: Job
metadata:
name: cityflow-cpu-normal
namespace: cityflow
spec:
backoffLimit: 0
template:
spec:
restartPolicy: Never
containers:
- name: cpu-work
image: cityflow-cpu-work:1.0
imagePullPolicy: IfNotPresent
resources:
requests:
cpu: "1"
limits:
cpu: "1"kubectl apply -f job-cpu-normal.yaml
kubectl wait --for=condition=Complete job/cityflow-cpu-normal -n cityflow --timeout=60s
kubectl logs -n cityflow -l job-name=cityflow-cpu-normaljob.batch/cityflow-cpu-normal created
job.batch/cityflow-cpu-normal condition met
[cpu-work] primes below 1,500,000: 114,155
[cpu-work] elapsed seconds: 5.18Now the identical image, the identical task, with limits.cpu cut to 100m - one-tenth of a CPU core:
resources:
  requests:
    cpu: "100m"
  limits:
    cpu: "100m"
kubectl apply -f job-cpu-throttled.yaml
kubectl wait --for=condition=Complete job/cityflow-cpu-throttled -n cityflow --timeout=180s
kubectl logs -n cityflow -l job-name=cityflow-cpu-throttled
kubectl get job cityflow-cpu-throttled -n cityflowjob.batch/cityflow-cpu-throttled created
job.batch/cityflow-cpu-throttled condition met
[cpu-work] primes below 1,500,000: 114,155
[cpu-work] elapsed seconds: 147.09
NAME STATUS COMPLETIONS DURATION AGE
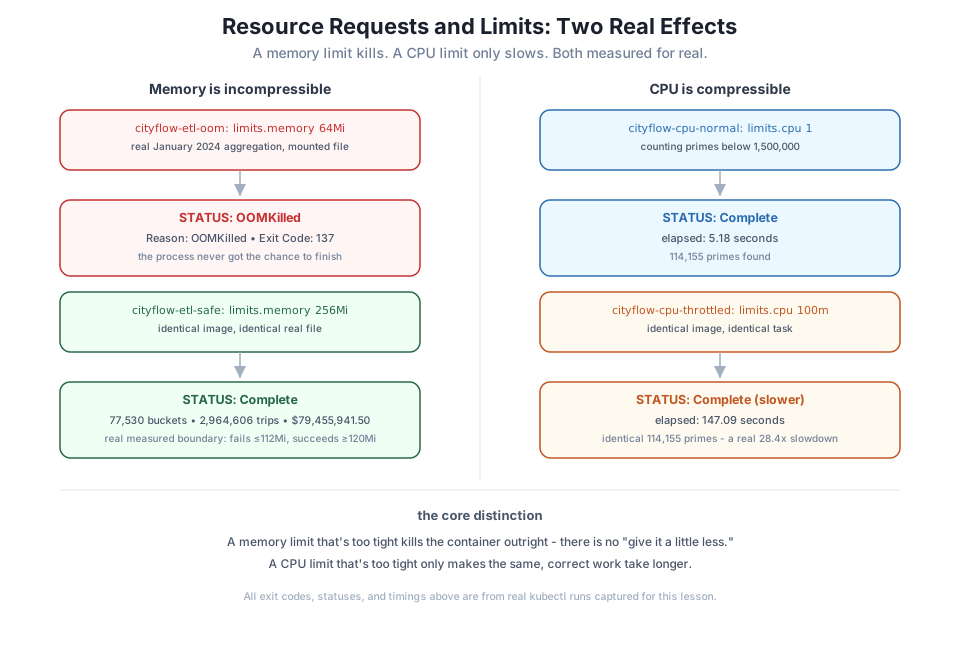
cityflow-cpu-throttled Complete 1/1 2m31s 2m31s5.18 seconds at a 1-core limit, 147.09 seconds at a 100m limit - a real, measured 28.4x slowdown. The container was never killed, never restarted, never reported an error of any kind - STATUS: Complete, exit code 0, the identical correct answer, 114,155 primes, both times. It simply ran at roughly a tenth of the speed, because the kernel genuinely only let it use a tenth of a CPU core in every scheduling period. This is throttling working exactly as designed: a resource ceiling that costs time, never correctness, and never a crash.
kubectl delete job cityflow-etl-oom cityflow-etl-safe cityflow-cpu-normal cityflow-cpu-throttled -n cityflowRun the same for mem in ... sweep from this lesson’s second section on your own machine, against the real January 2024 file. Confirm you find a real fail/succeed boundary somewhere in a similar range - it may not land at exactly 112/120 MiB, since the exact number depends on your machine’s Python build and allocator behavior, but a real boundary should exist.
Hint
If every value in the sweep succeeds, you likely need to go lower (try 32m, 48m) - the point is finding where it genuinely breaks, not confirming a specific number.
Edit a Job’s resources: block so requests.memory is larger than limits.memory (e.g. requests: 256Mi, limits: 128Mi) and try to apply it.
Hint
The API server itself rejects this at kubectl apply time with a validation error - a request can never exceed its own limit, since the request is a promise the scheduler makes about a ceiling the container isn’t even allowed to cross.
Run the CPU-work Job a third time with limits.cpu: "500m" (half a core) and predict its elapsed time before running it, based on the 1-core and 100m results this lesson already measured.
Hint
If the slowdown scales roughly linearly with the CPU fraction (it usually does, for a single-threaded, purely CPU-bound task like this one), 500m should land somewhere near twice the 1-core time - a real, testable prediction, not a guess with nothing to check it against.
A request is what the scheduler uses to decide where a pod can go; a limit is what the kubelet and container runtime enforce once it’s there, and the two resources this lesson measured are enforced in genuinely different ways. Memory is incompressible, so a container that exceeds its memory limit is OOMKilled outright - this lesson found the real boundary for CityFlow’s actual ETL job (fails at 112Mi and below, succeeds at 120Mi and above) and confirmed the identical behavior as a real Kubernetes Job, reading Reason: OOMKilled and Exit Code: 137 straight from kubectl describe pod. CPU is compressible, so a container that exceeds its CPU limit is only throttled, never killed - measured directly on an identical CPU-bound task, 5.18 seconds at a 1-core limit versus 147.09 seconds at a 100m limit, a real 28.4x slowdown, with the exact same correct result both times.
requests - a scheduling promise, read once at pod-placement time.limits - a hard ceiling, enforced continuously by the kubelet and container runtime while the container runs.SIGKILL, exit code 137), because there is no way to give a running process “a little less” memory it’s already using.Setting resource limits by guesswork is one of the most common real sources of production incidents in Kubernetes: too tight on memory, and a perfectly correct job gets killed under real load; too loose (or absent, like Lesson 1’s Job), and one misbehaving pod can starve everything else on its node. You’ve now watched both real failure modes happen on purpose, with real numbers behind each one, which is exactly the discipline Lesson 4 applies when it gives CityFlow’s actual ETL job its final, real resource limits.
You can now read an OOMKilled status and a throttled CPU limit as two genuinely different signals rather than “the container failed” in general. Lesson 3 gives you the full toolkit for going from a Kubernetes failure to its actual cause - kubectl logs, describe, and events together - on a real crash and a real scheduling failure, neither one staged after the fact.
Keep DATATWEETS free. Help fund practical data, AI, and engineering lessons for learners worldwide.
