Title here
Summary here
Module 2 Lesson 4 taught you a real debugging sequence for a crashing Docker container: docker ps -a to see it stopped, docker logs to read what it printed before dying, docker exec to poke around a still-running one, docker inspect for the exact exit code. Kubernetes has its own version of that sequence, built for a world where a “container” is one part of a pod that might have several, and where a pod can fail for reasons that have nothing to do with its own code at all - like never getting scheduled in the first place. This lesson gives you the three tools that cover both cases, and uses them on two failures that are completely real, not staged after the fact to look instructive.
By the end of this lesson, you will be able to:
kubectl logs, kubectl describe pod, and kubectl get events together as one debugging sequence, the way Module 2 used four Docker commands.kubectl logs alone cannot show you anything about at all.kubectl logs <pod> [-c <container>] - stdout/stderr from a container that has run, or is running. This is the direct equivalent of docker logs, with one addition: since a pod can hold more than one container (an initContainer and a main container, as Lesson 1’s Job just showed), you often need -c to say which one you mean.kubectl describe pod <pod> - the pod’s full current state: its containers’ State/Last State (including Reason and Exit Code for anything that’s terminated, exactly like Lesson 2’s OOMKilled), and a chronological Events section at the bottom recording everything the control plane has done to get this pod to where it is now.kubectl get events [-n <namespace>] --sort-by=.lastTimestamp - the same events describe shows for one pod, but across an entire namespace, sorted by time. This is what catches something describe on one specific pod might not - like a pod that was never created at all because it couldn’t be scheduled anywhere.Only the first of these needs a container that actually started. The other two work even when nothing ever ran - which is exactly the gap this lesson’s second failure lives in.
cityflow-borough-summary is a small, original job: it counts real zones per borough from the genuine 265-zone NYC taxi lookup table, then reports a count for each borough CityFlow tracks. It has one genuine bug.
# gate: skip
"""CityFlow's borough summary - a small, original job that counts real zones
per borough from the real 265-zone NYC taxi lookup table, then reports a
count for each borough CityFlow tracks. Contains a genuine bug: the code
assumes the airport borough is keyed "Newark" (a natural mistake, since EWR
is Newark Liberty International Airport), but the real dataset's Borough
column uses the TLC's actual code, "EWR" - so the lookup raises a real
KeyError."""
import csv
import os

DATA_PATH = os.environ.get("ZONE_DATA", "/data/taxi_zone_lookup.csv")

TRACKED_BOROUGHS = ["Manhattan", "Brooklyn", "Queens", "Bronx", "Staten Island", "Newark"]


def main():
    counts = {}
    with open(DATA_PATH, newline="", encoding="utf-8") as f:
        for row in csv.DictReader(f):
            b = row["Borough"]
            counts[b] = counts.get(b, 0) + 1

    print(f"CityFlow borough summary - {sum(counts.values())} zones loaded", flush=True)
    for borough in TRACKED_BOROUGHS:
        print(f"  {borough}: {counts[borough]} zones", flush=True)


if __name__ == "__main__":
    main()
The bug is a genuinely natural one: “EWR” is the airport code for Newark Liberty International Airport, so a reasonable person writing TRACKED_BOROUGHS by hand might write "Newark" without checking the real dataset - but the TLC’s own data uses "EWR", never the airport’s city name. Run as a Kubernetes Job:
kubectl apply -f job-crash.yaml
kubectl wait --for=condition=Failed job/cityflow-borough-summary -n cityflow --timeout=60s
kubectl get pods -n cityflow -l job-name=cityflow-borough-summary
job.batch/cityflow-borough-summary created
job.batch/cityflow-borough-summary condition met
NAME READY STATUS RESTARTS AGE
cityflow-borough-summary-7866w 0/1 Error 0 13s
cityflow-borough-summary-t877c 0/1 Error 0 3sTwo pods already - backoffLimit: 1 means one retry, and both attempts hit the identical bug. Start with kubectl logs:
kubectl logs -n cityflow cityflow-borough-summary-7866wCityFlow borough summary - 265 zones loaded
Manhattan: 69 zones
Brooklyn: 61 zones
Queens: 69 zones
Bronx: 43 zones
Staten Island: 20 zones
Traceback (most recent call last):
File "/app/borough_summary.py", line 29, in <module>
main()
~~~~^^
File "/app/borough_summary.py", line 25, in main
print(f" {borough}: {counts[borough]} zones", flush=True)
~~~~~~^^^^^^^^^
KeyError: 'Newark'The real traceback, in full - the exact same information docker logs would have given you, and enough on its own to find and fix this specific bug (change "Newark" to "EWR"). But kubectl logs only tells you what the code did. For the pod’s own status, go to describe:
kubectl describe pod -n cityflow cityflow-borough-summary-7866wStatus: Failed
Containers:
borough-summary:
State: Terminated
Reason: Error
Exit Code: 1
Started: Wed, 22 Jul 2026 13:46:40 +0330
Finished: Wed, 22 Jul 2026 13:46:40 +0330
Events:
Type Reason Age From Message
---- ------ ---- ---- -------
Normal Scheduled 22s default-scheduler Successfully assigned cityflow/cityflow-borough-summary-7866w to datatweets-docker-k8s-control-plane
Normal Pulled 22s kubelet Container image "cityflow-borough-summary:1.0" already present on machine
Normal Created 22s kubelet Created container: borough-summary
Normal Started 22s kubelet Started container borough-summaryReason: Error, Exit Code: 1 - a plain, uncaught Python exception, distinct from Lesson 2’s OOMKilled/137. The Events section confirms the pod was scheduled, pulled its image, and started completely normally - this failure has nothing to do with placement or resources at all; the container ran exactly as intended and the code itself raised an exception. Finally, kubectl get events at the namespace level shows the retry:
kubectl get events -n cityflow --sort-by=.lastTimestampLAST SEEN TYPE REASON OBJECT MESSAGE
22s Normal SuccessfulCreate job/cityflow-borough-summary Created pod: cityflow-borough-summary-7866w
12s Normal SuccessfulCreate job/cityflow-borough-summary Created pod: cityflow-borough-summary-t877c
9s Warning BackoffLimitExceeded job/cityflow-borough-summary Job has reached the specified backoff limitThe same Job-level retry story Module 6 Lesson 3 first showed you: two SuccessfulCreate events, one per attempt, then BackoffLimitExceeded once both have failed identically - the Job gave up correctly, because retrying a genuine code bug a third time was never going to produce a different result.
kubectl logs has nothing to show at allThis node’s real allocatable CPU capacity is 10 cores (kubectl describe node reports it directly). Ask for far more than that in a single container’s resource request:
apiVersion: batch/v1
kind: Job
metadata:
  name: cityflow-etl-oversized
  namespace: cityflow
spec:
  backoffLimit: 0
  template:
    spec:
      restartPolicy: Never
      containers:
        - name: etl
          image: cityflow-etl-k8s:1.0
          imagePullPolicy: IfNotPresent
          resources:
            requests:
              cpu: "50"
              memory: "256Mi"
            limits:
              cpu: "50"
              memory: "256Mi"
kubectl apply -f job-unschedulable.yaml
kubectl get pods -n cityflow -l job-name=cityflow-etl-oversizedjob.batch/cityflow-etl-oversized created
NAME READY STATUS RESTARTS AGE
cityflow-etl-oversized-7mx65 0/1 Pending 0 8sSTATUS: Pending, and it will stay Pending forever - not slowly starting, not crashing, not retrying. Try kubectl logs first, since that’s the natural first instinct after Failure 1:
kubectl logs -n cityflow cityflow-etl-oversized-7mx65Error from server (BadRequest): container "etl" in pod "cityflow-etl-oversized-7mx65" is a container-in-waiting and cannot currently be loggedNothing. This is the real gap kubectl logs cannot cross: the container has never started, so there is no log stream to read - Pending means the scheduler hasn’t even placed this pod on a node yet. Whatever went wrong happened before any code of yours ran. describe pod is where this failure actually shows up:
kubectl describe pod -n cityflow cityflow-etl-oversized-7mx65QoS Class: Guaranteed
Events:
Type Reason Age From Message
---- ------ ---- ---- -------
Warning FailedScheduling 8s default-scheduler 0/1 nodes are available: 1 Insufficient cpu. preemption: 0/1 nodes are available: 1 No preemption victims found for incoming pod.FailedScheduling, Insufficient cpu, straight from default-scheduler itself. This is Lesson 2’s requests.cpu mechanism, from the other side: the scheduler read this container’s request - 50 full cores - compared it against every node’s allocatable capacity, found none big enough, and never placed the pod at all. kubectl get events at the namespace level shows the identical line, since a FailedScheduling event belongs to the pod, not to any container inside it:
kubectl get events -n cityflow --field-selector involvedObject.name=cityflow-etl-oversized-7mx65LAST SEEN TYPE REASON OBJECT MESSAGE
8s Warning FailedScheduling pod/cityflow-etl-oversized-7mx65 0/1 nodes are available: 1 Insufficient cpu. preemption: 0/1 nodes are available: 1 No preemption victims found for incoming pod.Why this failure needed a different tool
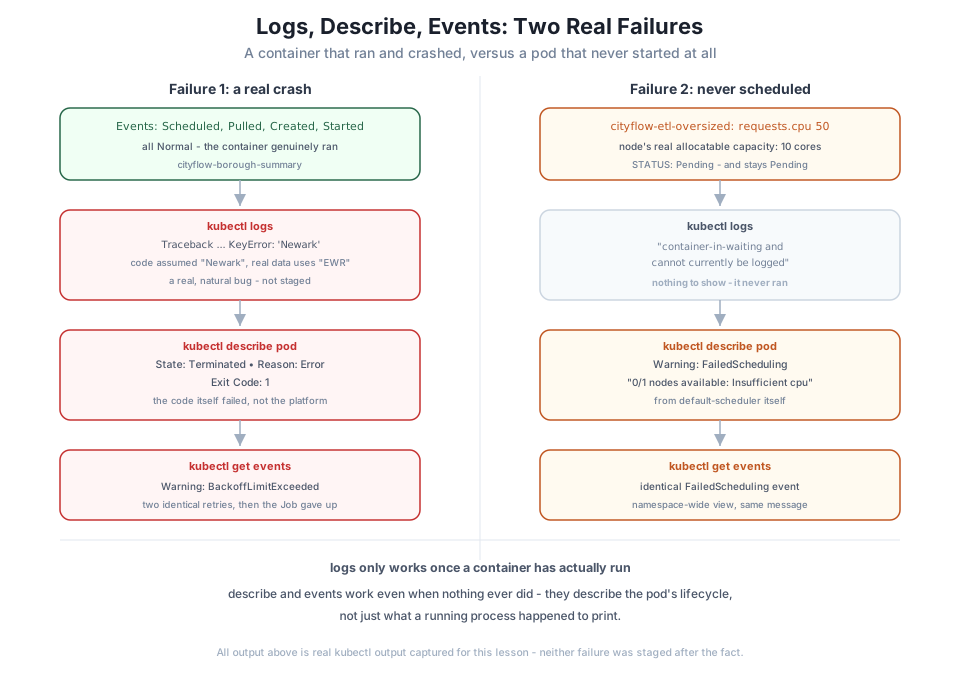
Failure 1’s traceback was in the container’s own stdout, because the container genuinely ran. Failure 2 produced no logs anywhere, because nothing ever ran - the entire problem lived in the scheduler’s own decision, one layer above any container. describe/events cover both cases because they describe the pod’s actual lifecycle, not just what a running process happened to print; logs only covers the case where a process got the chance to print anything at all.
kubectl delete job cityflow-borough-summary cityflow-etl-oversized -n cityflowChange TRACKED_BOROUGHS’s "Newark" entry to "EWR", rebuild the image, and rerun the Job. Confirm it now reports Complete with a real zone count for EWR (the real dataset has exactly one EWR zone: Newark Airport itself).
Hint
kubectl logs on the fixed run should show six real borough lines with no traceback at all - if EWR still isn’t showing up, double-check you edited the list and not just the print statement, since the KeyError comes from the dictionary lookup, not from formatting.
Change job-unschedulable.yaml’s request from an unreasonable CPU number to an unreasonable memory number instead (e.g. memory: "500Gi"), and confirm kubectl describe pod reports Insufficient memory rather than Insufficient cpu.
Hint
The scheduler evaluates every resource dimension in a pod’s request independently - a pod can fail scheduling on CPU, memory, or (less commonly in this course) storage, and describe’s FailedScheduling message always names the specific dimension that didn’t fit.
Change borough_summary.py’s DATA_PATH default to a file that doesn’t exist in the image, rebuild, and rerun. Confirm kubectl logs shows a FileNotFoundError traceback rather than the KeyError this lesson diagnosed, and that kubectl describe pod still reports Reason: Error, Exit Code: 1 - the identical exit code for a completely different underlying bug.
Hint
A plain Exit Code: 1 on its own only tells you “an uncaught Python exception happened” - it takes kubectl logs’s actual traceback to know which one, which is exactly why this lesson’s sequence always starts with logs before describe, for any failure where a container did get to run.
Two real failures, diagnosed with the same three tools. A genuine bug - TRACKED_BOROUGHS assuming the airport borough is keyed "Newark" when the real dataset uses "EWR" - produced a real KeyError traceback in kubectl logs, a Reason: Error/Exit Code: 1 in kubectl describe pod, and a BackoffLimitExceeded event in kubectl get events once both retries hit the identical bug. A resource request for 50 CPU cores against a 10-core node produced nothing at all in kubectl logs - the container never started, so there was nothing to log - and instead showed up as a Warning FailedScheduling event, Insufficient cpu, visible in both describe and get events, the moment the scheduler gave up trying to place it. The same three tools covered both failures completely, but only because each one reaches a different layer: logs sees what a running container printed; describe/events see the pod’s actual lifecycle, whether or not a container ever got the chance to run at all.
kubectl logs [-c <container>] - stdout/stderr from a container that has actually run; nothing to show for a pod stuck at Pending.kubectl describe pod - full current state, including State/Last State/Reason/Exit Code for containers, and a chronological Events list for the pod itself.kubectl get events --sort-by=.lastTimestamp - the namespace-wide event stream, useful for catching a scheduling failure that never produced a specific pod’s logs at all.FailedScheduling / Insufficient <resource> - the scheduler’s own, specific account of why a pod couldn’t be placed, directly tied to that pod’s requests.Reaching for kubectl logs first and finding nothing is a genuinely disorienting moment the first time it happens - it looks like Kubernetes is hiding information, when really it’s telling you, correctly, that the problem is one layer earlier than any log could ever show. Knowing to check describe/events at that point, rather than assuming the tooling is broken, is the single habit that turns “my pod is stuck and I don’t know why” into a specific, fixable diagnosis in under a minute - exactly the skill Lesson 4 assumes as it packages CityFlow’s real ETL job with the resource limits and logging this module has now fully justified.
You can now read a Kubernetes failure back to its real cause, whether the container ran and crashed or never started at all. Lesson 4 puts everything this module has taught - the object translation from Lesson 1, the resource limits from Lesson 2, and the debugging habits from this lesson - into CityFlow’s actual ETL job, packaged for Kubernetes for real.
Keep DATATWEETS free. Help fund practical data, AI, and engineering lessons for learners worldwide.
