Title here
Summary here
For six modules you have been an evaluator. You built golden datasets for Docent — our Meridian documentation assistant — scored its answers with deterministic metrics and an LLM judge, measured its retrieval and faithfulness, and graded its agent trajectories. Every one of those was an offline activity: you gathered a fixed set of questions, ran Docent over them, and asked one question of the results — is it good? You did all of it before shipping, on data you controlled.
This module changes the tense from future to present. Docent is live now. Real developers are typing real questions you never wrote down, at 3 a.m., from time zones you didn’t test in. The question is no longer “is it good?” measured against a dataset — it is “what is it doing right now?” measured against live traffic. That is observability, and it is a different discipline with a different, blunt first principle: you can only debug what you captured. This lesson frames the handoff from evaluation to observability, introduces the three pillars you’ll build the rest of the module on, and — because this is a hands-on course — makes one real live Docent call and turns it into a structured observation record you can inspect.
In this lesson, you will:
Evaluation and observability are easy to blur together because both are about “quality,” but they answer different questions at different times, and confusing them is how teams end up flying blind in production despite a green test suite.
Evaluation is what Modules 1 through 6 were about. You hold the inputs fixed — a golden set of questions with known-good reference answers — and you measure Docent against them before you ship a change. It is repeatable by design: the same dataset, the same metric, run today or next week, tells you whether a prompt tweak made Docent better or worse. Evaluation is a lab. Its great strength is control; its great limitation is that the lab is not the world. Your golden set has the questions you thought to ask.
Observability is what happens after the change ships. Now the inputs are not fixed — they are whatever real users send, which is unpredictable, unlabeled, and unbounded. You cannot compute a faithfulness score against a reference answer, because there is no reference answer for “how do I migrate my eu-west database to ap-south during a maintenance window?” What you can do is capture what happened — the exact prompt, the exact response, how long it took, how much it cost, which docs were retrieved — so that when something looks wrong, you can see it, and when it breaks, you can trace why. Observability is the field. Its strength is that it is real traffic; its challenge is that you get no answer key.
Neither replaces the other. Evaluation without observability ships confidently and then goes dark the moment real users arrive. Observability without evaluation sees everything in production but can’t tell whether a proposed fix actually helps before you roll it out. This module is the production side — the field instrumentation — and it assumes the lab work of the first six modules is already in place.
Offline eval and online observability are complementary, not competing
A useful way to hold the two together: evaluation is a controlled experiment; observability is continuous measurement. You use evaluation to decide whether to ship a change, and observability to learn what that change actually did once it met real traffic — which then feeds your next evaluation (Module 5 of this course showed how production logs become tomorrow’s test cases). The loop only closes if both halves exist. A team that only evaluates has confidence but no visibility; a team that only observes has visibility but no way to safely improve.
Observability as a field predates LLMs — it grew up around web services and distributed systems, and it rests on three classic pillars. Each one answers a different shape of question, and all three apply directly to an LLM app like Docent.
Logs are discrete events. Each log entry is one thing that happened, recorded with its details. For Docent, the natural unit is one model call: a single record saying “at this time, for this question, Docent called claude-haiku-4-5, sent this prompt, got back this answer, used this many tokens, and took this long.” Logs are how you answer questions about a specific request — “what exactly did we send the user who complained at 14:32?” You cannot reconstruct that after the fact; you either logged it or you didn’t.
Metrics are aggregate numbers over time. Instead of one event, a metric is a value you roll up across many events and watch as a time series: request rate (calls per minute), error rate (fraction that failed), p95 latency (the slow tail, not the average), tokens per request, and cost per day. Metrics are how you answer questions about the system as a whole — “is Docent slower this week than last?” or “did that prompt change double our token spend?” A single log can’t tell you a trend; a metric is built for exactly that.
Traces are the causal path of one request through the system. Docent doesn’t just make one flat call — a request flows through retrieval (find the relevant docs), then generation (call Claude with those docs as context), and in the agentic version, through tool calls in between. A trace stitches those steps into one connected timeline, tied together by a shared trace id, so you can see where the time and the tokens actually went. Traces are how you answer “why was this request slow?” — was it retrieval, or the model call, or a redundant tool loop?
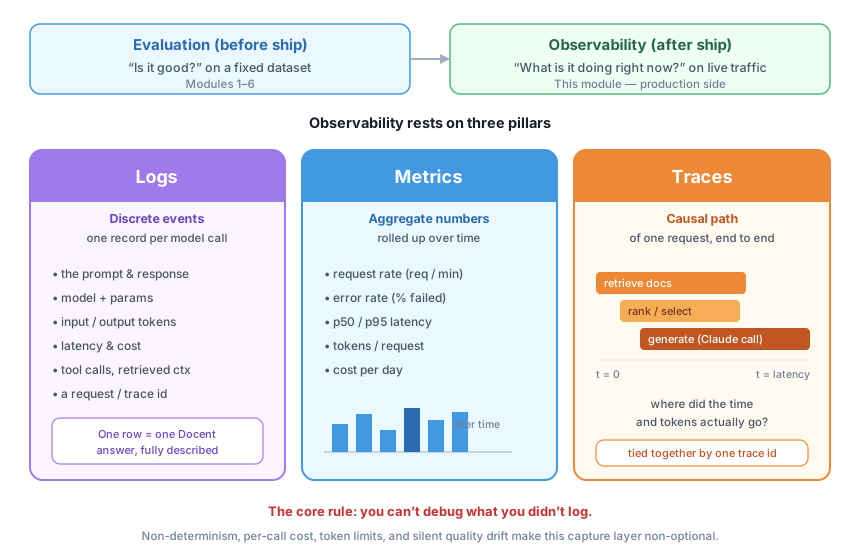
A quick way to keep the three straight: a log answers “what happened in this one request?”, a metric answers “what is happening across all requests, over time?”, and a trace answers “what happened within one request, step by step?”. You need all three because a metric spike (“p95 latency doubled at noon”) sends you to the traces (“the model call is the slow span”), which send you to the logs (“here are the exact requests that were slow”). The rest of this module builds each pillar for Docent: Lesson 2 is logs, later lessons are traces and metrics.
Ordinary web observability already captures a lot — timestamps, status codes, request duration, error stack traces. An LLM app needs all of that and a layer specific to the fact that the expensive, unpredictable thing in the request is a model call. If you only capture web telemetry, you’ll know that a request took 1.4 seconds and returned HTTP 200, and you will still have no idea what Docent actually said or why it cost what it cost. Here is the LLM-specific layer, and why each field earns its place:
claude-haiku-4-5) and settings like max_tokens. When behavior changes, the first question is “did the model or a parameter change?”, and you can only answer it if you recorded them per call.The rule underneath the whole list is the one from the module intro, and it is worth repeating because it drives every design decision ahead: you can’t debug what you didn’t log. There is no going back to capture a field after a request has already served — the model output is gone the moment you drop it. Deciding what to capture is therefore not a detail you tune later; it is the core design of your observability layer, and it is what Lesson 2 makes rigorous.
You might reasonably ask why this deserves a whole module rather than “just log your requests like any service.” The answer is that LLM apps break in ways ordinary services don’t, and every one of those ways is a reason the classic playbook is not enough on its own.
That last point is the throughline of this module. The scariest LLM failures are the ones that don’t look like failures, and the only defense is an observability layer rich enough to make them visible. Let’s start building it — in the smallest possible way — right now.
Enough framing. Let’s make one real Docent call and capture it as a structured observation record — the seed of everything Lesson 2 will grow into a proper logging system. We’ll reuse the minimal Docent (keyword retrieval, then a Claude call), but this time we wrap the model call in three things: a time.time() measurement around it for latency, a read of msg.usage for the token counts, and a dictionary that packages the whole thing — model, question, answer, tokens, latency, and a request id — into one inspectable record.
import warnings
warnings.filterwarnings("ignore")
import anthropic, json, time

client = anthropic.Anthropic()  # reads ANTHROPIC_API_KEY from the environment

DOCS = [
    {"id": "auth", "title": "Authentication",
     "text": "Meridian authenticates every request with an API key sent in the Authorization header as a bearer token."},
    {"id": "ratelimits", "title": "Rate Limits",
     "text": "The Free plan allows 60 requests per minute. The Pro plan allows 600 requests per minute. Exceeding the "
             "limit returns HTTP 429 with a Retry-After header giving the seconds to wait. Rate limits are applied per "
             "API key, not per account."},
    {"id": "plans", "title": "Plans and Pricing",
     "text": "Meridian has three plans. Free costs 0 dollars per month and includes 1 GB of storage. Pro costs 25 dollars "
             "per month and includes 50 GB of storage. Scale costs 199 dollars per month and includes 500 GB of storage."},
    {"id": "errors", "title": "Error Codes",
     "text": "Meridian uses standard HTTP status codes. 400 means a malformed request, 401 means a missing or invalid API "
             "key, 403 means the key is valid but lacks permission, 404 means the resource does not exist, and 429 means "
             "the rate limit was exceeded. 5xx codes indicate a server-side error and should be retried with backoff."},
    {"id": "backups", "title": "Backups",
     "text": "Automatic daily backups are retained for 7 days on the Free plan, 30 days on Pro, and 90 days on Scale."},
    {"id": "sdks", "title": "SDKs",
     "text": "Official SDKs are available for Python, JavaScript, and Go. The SDK reads the MERIDIAN_API_KEY environment variable by default."},
]

def retrieve(question, docs, k=2):
    q = set(question.lower().split())
    scored = sorted(docs, key=lambda d: len(q & set((d["title"] + " " + d["text"]).lower().split())), reverse=True)
    return scored[:k]

def docent_answer_observed(question, docs, model="claude-haiku-4-5"):
    """Answer the question AND return a structured observation record of the call."""
    ctx = "\n\n".join(f"[{d['id']}] {d['title']}\n{d['text']}" for d in retrieve(question, docs))
    prompt = (f"Answer the question using ONLY the context. If the context does not contain the answer, say "
              f"\"I don't have that in the docs.\" Be concise.\n\nContext:\n{ctx}\n\nQuestion: {question}")

    start = time.time()                                   # latency: start the clock
    msg = client.messages.create(model=model, max_tokens=200,
                                 messages=[{"role": "user", "content": prompt}])
    latency_s = time.time() - start                       # latency: stop the clock

    return {
        "request_id": "req-0001",
        "model": model,
        "question": question,
        "answer": msg.content[0].text,
        "input_tokens": msg.usage.input_tokens,           # tokens: straight from the API
        "output_tokens": msg.usage.output_tokens,
        "latency_s": round(latency_s, 3),
    }

record = docent_answer_observed(
    "What HTTP status code does Meridian return when you exceed the rate limit?", DOCS)
print(json.dumps(record, indent=2))
{
"request_id": "req-0001",
"model": "claude-haiku-4-5",
"question": "What HTTP status code does Meridian return when you exceed the rate limit?",
"answer": "HTTP 429.",
"input_tokens": 219,
"output_tokens": 7,
"latency_s": 1.407
}That dictionary is a real observation, captured live. It says everything the module intro promised you’d want: which model answered, what it was asked, what it said, how many tokens went in (219) and came out (7), and how long the call took (1.407 seconds). From input_tokens and output_tokens you could compute cost; from many such records you could compute p95 latency; and request_id is the thread that would tie this log line to a trace. It is a tiny thing, but it is the atom of an LLM observability system — and notice what made it possible: we captured the fields at the moment of the call, because there is no way to recover them afterward.
These numbers are a real run, and they will vary
The record above came from a live call to claude-haiku-4-5. Because the model is non-deterministic, re-running the exact code will give you a similar but not identical record — the answer text might be “HTTP 429” or “Meridian returns a 429.”, output_tokens will wobble by a few, and latency_s depends on the network and will differ every time. That variability is not a bug in the demo; it is the reason this module exists. You can’t assert an exact expected value on a live LLM call, so you capture what actually happened and reason over the distribution — which is exactly what logs, metrics, and traces are for.
To be clear about what is reproducible: the model call varies, but code that merely formats a record is deterministic. If you separate the two — one function makes the live call, another just serializes the record — the formatting half returns byte-identical output every time:
def format_record(record):
    """Pure formatting: same record in, same string out, every time."""
    return json.dumps(record, indent=2)

fixed = {"request_id": "req-0001", "model": "claude-haiku-4-5",
         "question": "What HTTP status code does Meridian return when you exceed the rate limit?",
         "answer": "429", "input_tokens": 320, "output_tokens": 5, "latency_s": 1.234}

print(format_record(fixed))
print(format_record(fixed))   # run twice: identical
{
"request_id": "req-0001",
"model": "claude-haiku-4-5",
"question": "What HTTP status code does Meridian return when you exceed the rate limit?",
"answer": "429",
"input_tokens": 320,
"output_tokens": 5,
"latency_s": 1.234
}
{
"request_id": "req-0001",
"model": "claude-haiku-4-5",
"question": "What HTTP status code does Meridian return when you exceed the rate limit?",
"answer": "429",
"input_tokens": 320,
"output_tokens": 5,
"latency_s": 1.234
}That split — a non-deterministic call whose result is captured into a deterministic record you can store, format, and query — is the shape of every logging system you’ll build in this module. Lesson 2 takes this exact record and makes it a proper, structured log: consistent fields, added cost, and a real logger writing one JSON line per call.
Take these eight things you might want to know about a live Docent and label each as belonging to logs, metrics, or traces: (a) the exact answer Docent gave the user who complained at 14:32; (b) the average tokens per request today versus yesterday; (c) whether retrieval or the model call ate most of the time on one slow request; (d) Docent’s error rate this hour; (e) the full prompt sent on a single request; (f) cost per day over the last week; (g) the step-by-step path of one agentic request through its tool calls; (h) p95 latency. Write your labels, then justify the two you found hardest.
Hint
Anchor on the three defining questions: a log answers “what happened in this one request?” (so a, e), a metric answers “what is happening across all requests over time?” (so b, d, f, h), and a trace answers “what happened within one request, step by step?” (so c, g). The tricky ones are usually (e) versus a trace: the full prompt on one request is a log field, but which span consumed the time on that request is a trace — same request, different pillar, because one is a recorded value and the other is a decomposition of the path.
Starting from docent_answer_observed, add two fields to the returned record: retrieved_ids (the ids of the docs retrieve selected, so you can later diagnose retrieval problems) and cost_usd, a rough cost computed from the token counts. Use illustrative prices of 1 dollar per million input tokens and 5 dollars per million output tokens. Run it on one question and print the record. Why does capturing retrieved_ids matter for a RAG app specifically?
Hint
Have retrieve also hand back the ids (or call it once and reuse the result): hits = retrieve(question, docs); retrieved_ids = [d["id"] for d in hits]. For cost, cost_usd = round(rec["input_tokens"]/1e6*1.0 + rec["output_tokens"]/1e6*5.0, 6). The cost value comes straight from tokens, so it’s deterministic given a fixed record even though the tokens themselves vary run to run. retrieved_ids matters because for a RAG app a wrong answer is often a retrieval miss — if the right doc was never pulled in, no amount of prompt tuning fixes it, and you can only tell the difference if you logged what was retrieved.
Write down, in prose, one concrete way Docent could get worse in production while every ordinary web monitor (status codes, latency, error rate) stays completely green. Then state which field from “what an LLM app must capture” you would need in your logs to notice it, and how you’d use it. The goal is to feel why quality regressions are the failure mode that motivates this whole module.
Hint
Any answer where Docent responds successfully but incorrectly works: a model or prompt change makes it start confidently answering out-of-scope questions instead of refusing, or a retrieval bug makes it pull the wrong doc and cite a wrong price — HTTP 200, normal latency, no error, wrong answer. To notice it you need the prompt and response captured (to sample and evaluate answers on live traffic), and ideally retrieved context (to tell a retrieval miss from a generation error). The move is exactly the loop from the note earlier: observability captures the raw material, and you run evaluation continuously over it to surface the silent failures nothing else catches.
Evaluation and observability answer two different questions at two different times. Evaluation — Modules 1 through 6 — asks “is it good?” against a fixed dataset before you ship; it is a controlled lab you own end to end. Observability — this module — asks “what is it doing right now?” on live, unlabeled, unbounded traffic after you ship; it is field instrumentation, and its first principle is that you can only debug what you captured. Observability rests on three pillars: logs (discrete per-call events — the prompt, response, model, tokens, latency, cost, and a request id), metrics (aggregate numbers over time like request rate, error rate, p95 latency, and cost per day), and traces (the causal path of one request through retrieval and generation). LLM observability is its own discipline because LLM apps fail in ways ordinary services don’t — non-determinism, per-call cost, token limits, prompt and version drift, and above all silent quality regressions that return a fluent, confident, wrong answer with no error at all. You made one live Docent call and captured it as a structured observation record — model, question, answer, 219 input tokens, 7 output tokens, 1.407 seconds — the atom that Lesson 2 grows into a real structured logging system.
The most expensive LLM failures in production are the ones that don’t look like failures. A crashed service pages someone; a fluent, confident, wrong Docent answer returns HTTP 200 in 1.4 seconds and pages no one — it just quietly misleads a developer who trusted it. Ordinary web observability, tuned for status codes and stack traces, is structurally blind to that class of problem. The only defense is an LLM-aware capture layer: log the prompts and responses so you can sample and evaluate live answers, track tokens and cost so a silent 500-token bloat shows up before the invoice does, and trace requests so “it’s slow sometimes” becomes “retrieval is the p95 bottleneck.” Building that layer is how you go from hoping Docent behaves in production to knowing what it’s doing — and it starts with capturing one honest record of one real call, which you just did.
You’ve crossed the line from evaluation to observability — from asking “is Docent good?” against a dataset you control to asking “what is Docent doing right now?” against live traffic you don’t. You met the three pillars that answer that question at different scales, saw exactly what an LLM app has to capture beyond ordinary web telemetry, and learned why silent quality regressions make this a discipline of its own. Then you made it real: one live call, one structured record, the atom of everything ahead. In Lesson 2 you’ll take that atom and build the molecule — a proper structured logger that stamps every Docent call with consistent fields, computes its cost, and writes one JSON line you can later filter, aggregate, and trace. Capture is the foundation; from here the module turns that captured data into the metrics and traces that let you actually run Docent in production with your eyes open.
Keep DATATWEETS free. Help fund practical data, AI, and engineering lessons for learners worldwide.
