Title here
Summary here
In Lesson 1 you saw the rule that governs this whole module: you can only debug what you captured. Now we build the first and most important capture mechanism — a log. Every time Docent answers a question about Meridian, a real call goes out to claude-haiku-4-5, tokens are spent, milliseconds tick by, and money is charged. If you don’t record that, it’s gone. And when a user reports “Docent was slow yesterday” or finance asks “why did the bill jump,” you’ll have nothing to look at.
But how you log matters as much as whether you log. A print("done") scattered through your code produces a wall of free text that a human can skim and a machine can do almost nothing with. The alternative is structured logging: each LLM call emits exactly one record made of named fields — model, tokens, latency, cost — as JSON. That record is queryable. You can filter it, aggregate it, and alert on it. This lesson turns Docent’s calls into those records with a reusable logging wrapper, so instrumentation happens automatically and consistently — and so the one thing that must never be logged, the API key, never is.
In this lesson, you will:
timestamp and trace_id to input_tokens, latency_ms, and est_cost_usdlogged_docent() wrapper that emits one structured record per real call to Claude, reading token counts from msg.usageImagine Docent has been live for a week and you want to answer three ordinary questions: How many calls used the Haiku model? What did we spend in total? Which requests were slower than 1.5 seconds? If your logs look like this —
Pro plan Q done, 14 tokens
took a while, cost was tiny
error on the SDK question
— you cannot answer any of them without a human reading every line and guessing. “Took a while” is not a number. “Cost was tiny” can’t be summed. There is no model field to count. Free text is written for a person to read one line at a time, and it collapses the moment you have thousands of lines and a question about them.
A structured log flips that. The same call becomes one record of named fields:
{"model": "claude-haiku-4-5", "output_tokens": 14, "latency_ms": 780.0, "est_cost_usd": 0.00027, "success": true}Now “how many Haiku calls” is a filter on model, “total spend” is a sum of est_cost_usd, and “slow requests” is latency_ms > 1500. The discipline is simple and worth stating plainly: one LLM call emits exactly one record, and everything you might later want to filter, group, or alert on is its own field — not buried in a sentence.
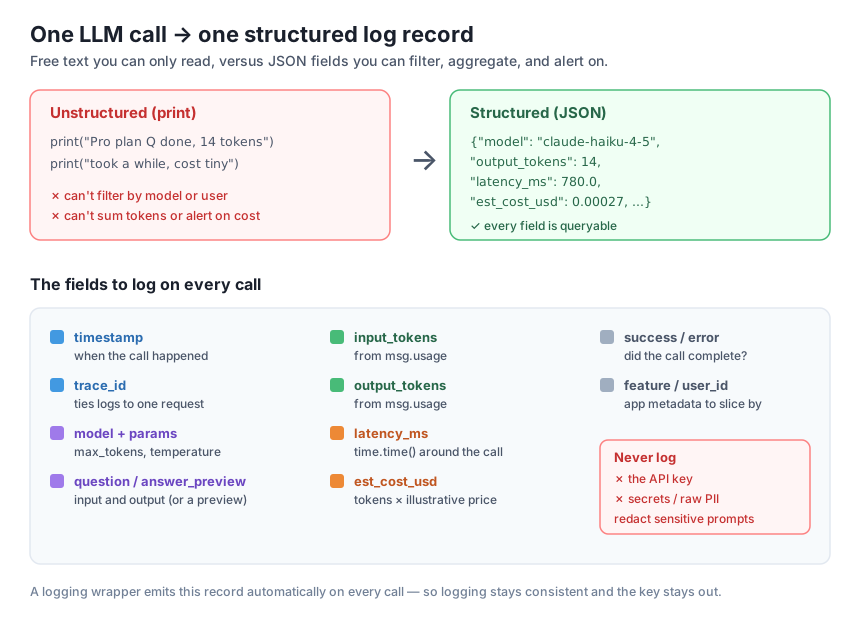
Before writing code, decide what goes in the record. A good LLM log entry captures the request, the response, the cost of both, and enough context to slice the data later. Here is the field set we’ll use for Docent, grouped by what it’s for:
timestamp (when it happened) and trace_id (a unique id per request, so you can tie this log to related logs; Lesson 3 builds on it).model and params (max_tokens, temperature). If you change the model or crank max_tokens, you want that in the record when you compare cost before and after.question and an answer_preview. Log the full text only when it’s safe; otherwise store a truncated preview or a hash. (More on that below — some prompts contain data you must not persist.)input_tokens and output_tokens, read straight from the API response’s usage, plus a derived est_cost_usd.success and, on failure, an error. A call that raised an exception is still an event worth logging; error rate is one of the first things you’ll alert on.feature name, a user_id, a request path — whatever lets you later ask “which feature is burning tokens?” These are the dimensions you group by.Two things are not on that list, deliberately. The API key is never logged — not in a field, not inside the prompt text, not anywhere. And raw PII or secrets that happen to ride along in a user’s prompt should be redacted or hashed before the record is written. A log is a record you keep and often ship to a third-party store; treat it as something an attacker or an auditor will eventually read.
The key is not application data — it’s a credential
Notice that the API key appears nowhere in the field list — not even indirectly. Your example code reads it from the environment (anthropic.Anthropic() with no arguments), so it lives in the client object, never in a variable you’d casually serialize. A structured record is JSON you will store, index, and maybe forward to a logging vendor; anything in it is effectively public within your org. The moment a key lands in a log, rotate it — it’s compromised. The safest design is the one where the key is simply never in scope of the logging code at all.
You could paste logging code after every client.messages.create(...) in your app. Don’t. You’ll forget a field in one place, spell latency_ms differently in another, and skip logging entirely on the error path — the exact case you most need. The fix is a wrapper: one function that wraps the model call, does the timing and the record-building in a single place, and returns the answer. Every call site just uses the wrapper, so logging is automatic and every record has the same shape.
Here is logged_docent() — it wraps the brief’s Docent (the retrieve() + Claude call you already know) and, on every call, emits one structured JSON record. Read the timing (time.time() before and after), the token counts (from msg.usage), and the illustrative cost formula:
import warnings
warnings.filterwarnings("ignore")
import json, time, uuid
import anthropic

client = anthropic.Anthropic()  # reads ANTHROPIC_API_KEY from the environment

DOCS = [
    {"id": "auth", "title": "Authentication",
     "text": "Meridian authenticates every request with an API key sent in the Authorization header as a bearer token. "
             "Create keys in the dashboard under Settings > API Keys. Keys are either test or live mode; test keys only "
             "touch sandbox data. A key is shown once at creation and cannot be recovered, only rotated."},
    {"id": "ratelimits", "title": "Rate Limits",
     "text": "The Free plan allows 60 requests per minute. The Pro plan allows 600 requests per minute. Exceeding the "
             "limit returns HTTP 429 with a Retry-After header giving the seconds to wait. Rate limits are applied per "
             "API key, not per account."},
    {"id": "plans", "title": "Plans and Pricing",
     "text": "Meridian has three plans. Free costs 0 dollars per month and includes 1 GB of storage. Pro costs 25 dollars "
             "per month and includes 50 GB of storage. Scale costs 199 dollars per month and includes 500 GB of storage. "
             "All plans include unlimited read replicas."},
    {"id": "errors", "title": "Error Codes",
     "text": "Meridian uses standard HTTP status codes. 400 means a malformed request, 401 means a missing or invalid API "
             "key, 403 means the key is valid but lacks permission, 404 means the resource does not exist, and 429 means "
             "the rate limit was exceeded. 5xx codes indicate a server-side error and should be retried with backoff."},
    {"id": "sdks", "title": "SDKs",
     "text": "Official SDKs are available for Python, JavaScript, and Go. Install the Python SDK with 'pip install meridian'. "
             "The SDK reads the MERIDIAN_API_KEY environment variable by default. All SDKs retry idempotent requests up to "
             "3 times on 5xx errors with exponential backoff."},
]

def retrieve(question, docs, k=2):
    q = set(question.lower().split())
    scored = sorted(docs, key=lambda d: len(q & set((d["title"] + " " + d["text"]).lower().split())), reverse=True)
    return scored[:k]

# Illustrative per-token prices in US dollars. These are teaching constants, NOT live pricing --
# always check current rates. The point is the shape of the calculation, not the exact number.
PRICE_PER_INPUT_TOKEN = 1.00 / 1_000_000    # $1.00 per million input tokens (illustrative)
PRICE_PER_OUTPUT_TOKEN = 5.00 / 1_000_000   # $5.00 per million output tokens (illustrative)

def estimate_cost(input_tokens, output_tokens):
    return input_tokens * PRICE_PER_INPUT_TOKEN + output_tokens * PRICE_PER_OUTPUT_TOKEN

def logged_docent(question, docs=DOCS, model="claude-haiku-4-5"):
    ctx = "\n\n".join(f"[{d['id']}] {d['title']}\n{d['text']}" for d in retrieve(question, docs))
    prompt = (f"Answer the question using ONLY the context. If the context does not contain the answer, say "
              f"\"I don't have that in the docs.\" Be concise.\n\nContext:\n{ctx}\n\nQuestion: {question}")
    trace_id = str(uuid.uuid4())
    start = time.time()
    try:
        msg = client.messages.create(model=model, max_tokens=200,
                                     messages=[{"role": "user", "content": prompt}])
        latency_ms = round((time.time() - start) * 1000, 1)
        answer = msg.content[0].text
        record = {
            "timestamp": time.strftime("%Y-%m-%dT%H:%M:%SZ", time.gmtime()),
            "trace_id": trace_id,
            "model": model,
            "params": {"max_tokens": 200, "temperature": 1.0},
            "question": question,                 # short & safe here; hash or preview if sensitive
            "answer_preview": answer[:80],         # a preview, not necessarily the whole output
            "input_tokens": msg.usage.input_tokens,
            "output_tokens": msg.usage.output_tokens,
            "latency_ms": latency_ms,
            "est_cost_usd": round(estimate_cost(msg.usage.input_tokens, msg.usage.output_tokens), 6),
            "success": True,
            "error": None,
            "feature": "docs_qa",                  # app metadata -- the API key is NEVER a field
        }
    except Exception as e:
        latency_ms = round((time.time() - start) * 1000, 1)
        answer = None
        record = {
            "timestamp": time.strftime("%Y-%m-%dT%H:%M:%SZ", time.gmtime()),
            "trace_id": trace_id, "model": model,
            "params": {"max_tokens": 200, "temperature": 1.0},
            "question": question, "answer_preview": None,
            "input_tokens": None, "output_tokens": None, "latency_ms": latency_ms,
            "est_cost_usd": None, "success": False,
            "error": type(e).__name__, "feature": "docs_qa",
        }
    print(json.dumps(record))    # one line == one structured record (route to your log store in prod)
    return answer, record
The shape is the point. All the timing, token-reading, and record-building happens once, inside the wrapper. The error path builds a record too, so a failed call is still an observable event. And there is no api_key field anywhere — the key stays inside client, out of the record entirely.
Let’s call logged_docent() on three real Meridian questions and print the structured records. These are genuine calls to claude-haiku-4-5, so the token counts, latency, and cost are real measurements from one run:
questions = [
    "How many requests per minute does the Pro plan allow?",
    "What does a 401 error mean?",
    "Which environment variable does the Python SDK read for the API key?",
]
for q in questions:
    logged_docent(q)
{"timestamp": "2026-07-07T10:30:24Z", "trace_id": "7d02f9fa-335e-4fbd-8bad-fd3ab02cbf61", "model": "claude-haiku-4-5", "params": {"max_tokens": 200, "temperature": 1.0}, "question": "How many requests per minute does the Pro plan allow?", "answer_preview": "The Pro plan allows 600 requests per minute.", "input_tokens": 200, "output_tokens": 14, "latency_ms": 1779.5, "est_cost_usd": 0.00027, "success": true, "error": null, "feature": "docs_qa"}
{"timestamp": "2026-07-07T10:30:24Z", "trace_id": "e97d0575-5eb5-4153-bfcd-f4c4a29874a6", "model": "claude-haiku-4-5", "params": {"max_tokens": 200, "temperature": 1.0}, "question": "What does a 401 error mean?", "answer_preview": "A 401 error means a missing or invalid API key.", "input_tokens": 213, "output_tokens": 16, "latency_ms": 900.1, "est_cost_usd": 0.000293, "success": true, "error": null, "feature": "docs_qa"}
{"timestamp": "2026-07-07T10:30:25Z", "trace_id": "0deb1617-3f65-4316-aca4-6427898980c5", "model": "claude-haiku-4-5", "params": {"max_tokens": 200, "temperature": 1.0}, "question": "Which environment variable does the Python SDK read for the API key?", "answer_preview": "The Python SDK reads the `MERIDIAN_API_KEY` environment variable by default.", "input_tokens": 226, "output_tokens": 22, "latency_ms": 772.9, "est_cost_usd": 0.000336, "success": true, "error": null, "feature": "docs_qa"}Three calls, three one-line records — each fully self-describing. Look at what’s now queryable: the first call took 1779.5 ms while the third took 772.9 ms (latency varies call to call, which is exactly why you log it every time, not once); output ran 14 to 22 tokens; each answer cost a fraction of a cent. Because this is a live model, a re-run would produce slightly different latencies and possibly a word or two different in answer_preview — but the record’s shape is identical every time, which is what lets you aggregate across runs. And crucially: scan every field. The prompt even mentions API keys (the SDK question), yet no key value appears — your key was read from the environment into client and never entered a record.
Read tokens from the response, don’t estimate them
The input_tokens and output_tokens above come from msg.usage, the API’s own count for that call — not a guess. That matters: cost is driven by tokens, so logging the API-reported usage means your est_cost_usd is grounded in real numbers rather than a len(text.split()) approximation that can be off by a lot. The price per token is still an illustrative constant here (verify current rates before trusting a bill), but the token counts are exact. Lesson 4 builds full cost and latency accounting — with percentiles — on top of exactly these fields.
Emitting records is half the job; the payoff is querying them. Once records are structured, aggregation is plain Python (or plain SQL, in a real store) — and it’s fully deterministic: given the same records, you get the same numbers every time. To show that cleanly, we’ll work over a fixed batch of hand-authored records (shaped exactly like the live ones, including one failure) so the output is reproducible. We’ll count calls by model, sum tokens, total the cost, compute the error rate and mean latency, and list the slow calls:
import json
from collections import Counter

# A fixed batch of structured records (in production these come from your log store).
LOGS = [
    {"trace_id": "a1", "model": "claude-haiku-4-5", "input_tokens": 200, "output_tokens": 14,
     "latency_ms": 780.0, "est_cost_usd": 0.000270, "success": True,  "feature": "docs_qa"},
    {"trace_id": "a2", "model": "claude-haiku-4-5", "input_tokens": 213, "output_tokens": 16,
     "latency_ms": 900.0, "est_cost_usd": 0.000293, "success": True,  "feature": "docs_qa"},
    {"trace_id": "a3", "model": "claude-haiku-4-5", "input_tokens": 226, "output_tokens": 22,
     "latency_ms": 1780.0, "est_cost_usd": 0.000336, "success": True, "feature": "docs_qa"},
    {"trace_id": "a4", "model": "claude-sonnet-4-5", "input_tokens": 240, "output_tokens": 60,
     "latency_ms": 2100.0, "est_cost_usd": 0.001020, "success": True, "feature": "docs_qa"},
    {"trace_id": "a5", "model": "claude-haiku-4-5", "input_tokens": 205, "output_tokens": 0,
     "latency_ms": 350.0, "est_cost_usd": 0.0, "success": False, "feature": "docs_qa"},
]

def summarize(logs):
    n = len(logs)
    by_model = Counter(r["model"] for r in logs)
    total_input = sum(r["input_tokens"] for r in logs)
    total_output = sum(r["output_tokens"] for r in logs)
    total_cost = sum(r["est_cost_usd"] for r in logs)
    errors = sum(1 for r in logs if not r["success"])
    mean_latency = sum(r["latency_ms"] for r in logs) / n
    return {
        "records": n,
        "by_model": dict(by_model),
        "total_input_tokens": total_input,
        "total_output_tokens": total_output,
        "total_cost_usd": round(total_cost, 6),
        "error_rate": round(errors / n, 3),
        "mean_latency_ms": round(mean_latency, 1),
    }

print(json.dumps(summarize(LOGS), indent=2))
print("--- slow calls (latency_ms > 1500) ---")
for r in LOGS:
    if r["latency_ms"] > 1500:
        print(f'{r["trace_id"]}  {r["model"]}  {r["latency_ms"]} ms')
{
"records": 5,
"by_model": {
"claude-haiku-4-5": 4,
"claude-sonnet-4-5": 1
},
"total_input_tokens": 1084,
"total_output_tokens": 112,
"total_cost_usd": 0.001919,
"error_rate": 0.2,
"mean_latency_ms": 1182.0
}
--- slow calls (latency_ms > 1500) ---
a3 claude-haiku-4-5 1780.0 ms
a4 claude-sonnet-4-5 2100.0 msEvery one of those numbers is a question answered by a field: how many calls per model, total tokens in and out, total spend, what fraction errored, average latency, and which specific requests breached a 1.5-second threshold. None of it required reading prose. Because the input is fixed and the code is pure Python, this is reproducible — running it a second time prints the identical block:
{
  "records": 5,
  "by_model": {
    "claude-haiku-4-5": 4,
    "claude-sonnet-4-5": 1
  },
  "total_input_tokens": 1084,
  "total_output_tokens": 112,
  "total_cost_usd": 0.001919,
  "error_rate": 0.2,
  "mean_latency_ms": 1182.0
}
--- slow calls (latency_ms > 1500) ---
a3  claude-haiku-4-5  1780.0 ms
a4 claude-sonnet-4-5 2100.0 msByte-for-byte identical. That reproducibility is the difference between logging and observability: the live calls vary, but the aggregates over your captured records are exact, so a dashboard built on them means the same thing every time you look. This is the seed of the alerting you’ll build later — error_rate > 0.05 or mean_latency_ms > 1500 are one comparison away, because the fields already exist.
Real prompts sometimes carry data you must not store verbatim. Extend logged_docent() so that instead of (or alongside) the full question, the record also carries a question_hash — a short hash of the question — and a question_len. Verify that two different questions produce two different hashes, and that the raw text can be omitted entirely while the record stays useful for grouping.
Hint
Use import hashlib and hashlib.sha256(question.encode()).hexdigest()[:12] for a short, stable id, plus len(question). The idea: a hash lets you tell “was this the same question?” and group by it without keeping the sensitive text. This is the same move you’d make for a prompt containing a customer’s real data — log a hash and a length, not the content. The API key, of course, is never hashed or logged; it simply isn’t in scope.
Copy the fixed LOGS batch and change some records’ feature field to a second value like "search_suggest". Then write an aggregation that returns, per feature, the number of calls and the total est_cost_usd. This is exactly how you’d answer “which feature is driving the bill?” in production — and it works only because feature is its own field.
Hint
Build a dict keyed by feature: iterate the logs and accumulate counts[r["feature"]] += 1 and costs[r["feature"]] += r["est_cost_usd"] (a collections.defaultdict(float) avoids key-check boilerplate). Round the summed cost when you print. Because the batch is fixed, re-running prints identical totals — the same determinism you saw with summarize().
Write a small check that scans a produced record and asserts no field’s value contains a real key. Since your example code never puts the key in the record, the assertion should pass trivially — the exercise is to make that guarantee explicit and think about where a key could accidentally leak in (e.g. logging the whole exception object, or dumping request headers).
Hint
Serialize the record with blob = json.dumps(record) and assert that your provider’s key prefix is not a substring — store the prefix in a variable, e.g. KEY_PREFIX = os.environ["ANTHROPIC_API_KEY"][:6] and assert KEY_PREFIX not in blob (read the marker from the env; never hard-code a key string in your source). Then note the two classic leak paths to avoid: logging str(exception) when it embeds a request that echoes headers, and logging raw HTTP headers (the Authorization header carries the credential). The defensive rule from the lesson holds — keep the key out of scope of the logging code, and there’s nothing to leak.
You turned Docent’s model calls from ephemeral events into durable, queryable records. A print("done") can only be read; a structured JSON record — timestamp, trace_id, model, params, question, answer_preview, input_tokens, output_tokens, latency_ms, est_cost_usd, success, error, feature — can be filtered, summed, and alerted on. You built a logged_docent() wrapper so logging happens once, consistently, on every call (including the error path), reading real token counts from msg.usage and deriving an illustrative cost. Run live on three Meridian questions, it emitted three clean records with genuine latencies (772.9–1779.5 ms) and sub-cent costs. Then you aggregated a fixed batch deterministically — 4 Haiku vs 1 Sonnet call, 1084 input and 112 output tokens, 0.001919 dollars total, a 0.2 error rate, 1182.0 ms mean latency, and two slow calls over 1.5 s — and got byte-identical output on a re-run. Through all of it, one rule held without exception: the API key is never a field, never in the prompt text logged, never anywhere in a record.
input_tokens/output_tokens from msg.usage for exact counts; the per-token price is an illustrative constant you should verify.Every production LLM incident — a latency spike, a cost blowout, a wave of errors — is diagnosed from logs, and you only have the logs you thought to capture before the incident. Teams that logged free text end up grepping through prose and guessing; teams that logged structured records answer “which model, which feature, how many tokens, how slow, how much” in one query. Structuring the log is what turns “the bot felt slow” into “p95 latency on docs_qa rose 40% after we raised max_tokens” — a specific, fixable finding. And the security stakes are just as concrete: a single API key accidentally serialized into a log that ships to a third-party store is a credential leak requiring immediate rotation. Building the wrapper right, once, gives you both the observability and the safety for free on every call thereafter.
You now emit one structured, queryable record per Docent call — with tokens, latency, and cost, and without the key. But a real request isn’t a single model call: Docent retrieves doc pages, then generates an answer, and a slow request might be slow in either step. A flat log per call can’t show you that internal structure. In Lesson 3 you’ll connect related records with the trace_id you’re already logging and organize a request into spans — retrieval span, generation span — so a single trace tells you exactly where the milliseconds and tokens went inside one request. The field you added today, trace_id, is the thread the whole trace hangs on.
Keep DATATWEETS free. Help fund practical data, AI, and engineering lessons for learners worldwide.
