Title here
Summary here
In Lesson 1 you stood up continuous monitoring for Docent — our Meridian documentation assistant — and watched the dashboards: request rate, latency, cost, refusal rate, a rolling quality proxy. Dashboards tell you what the numbers are right now. This lesson is about the harder skill: noticing when those numbers have moved in a way that means Docent is quietly getting worse — before a user files the ticket that tells you so.
The failure mode here is not a crash. It’s decay. Real Meridian users start asking about billing, a topic your golden set barely covers, and Docent’s answers on that slice quietly slide. Someone ships a “small” prompt tweak on a Friday and the recent window’s judge scores drop a fifth without a single error being thrown. The p95 latency graph stays flat, every request returns HTTP 200, and Docent is measurably worse than it was on Tuesday. Catching that is a matter of comparing windows — recent versus baseline — and deciding, with a threshold and a little statistics, whether the difference is a real shift or just sample noise. That’s what you’ll build here, deterministically, so it flags the same drift on every run.
In this lesson, you will:
“Docent got worse” is too vague to act on. To fix decay you first have to name what changed, because the diagnosis and the fix are different for each. There are three things that can move, and one important distinction in how they move.
Cutting across all three is the distinction between drift and a regression:
The direction of causation tells you which one you’re chasing
A quick diagnostic: line up your quality drop against your deploy log. If the drop starts at the exact hour of a prompt or model change, you have a regression — attributable and reversible. If the quality slope bends but nothing shipped, suspect drift driven by changing inputs: pull the input distribution for the same window and look for a new or growing topic. The two demos in this lesson mirror those two investigations — one watches the input distribution, the other compares score windows around a known prompt change.
You can’t eyeball a drift into existence; you detect it by comparison. Every method below reduces to “is the recent period different enough from a trusted baseline to act on?”
billing), or an existing one ballooning, is input drift you can see before it shows up as a quality drop — an early warning that your golden set is falling out of sync with reality.The unifying idea is that a single number is meaningless without a baseline to compare it to. “The mean score is 0.66” tells you nothing; “the mean score is 0.66, down from a baseline of 0.87” tells you to page someone.
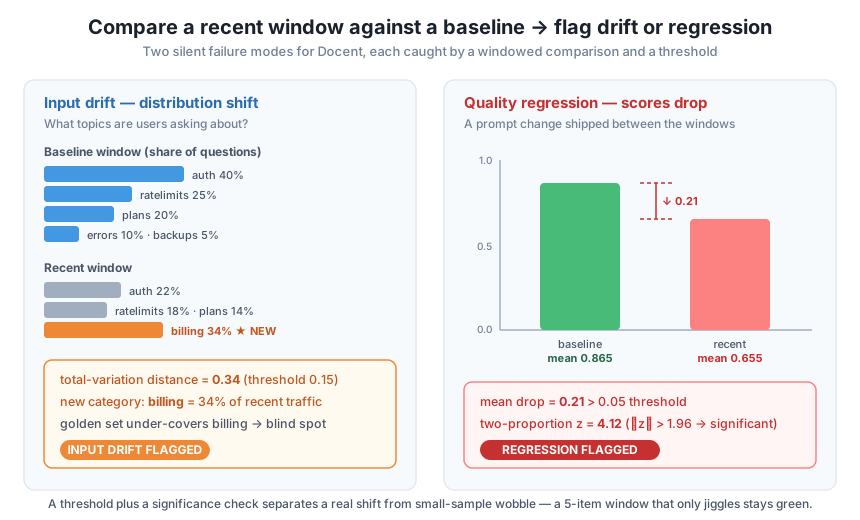
Let’s make the left panel real. We have topic category counts for two windows of Docent traffic — a trusted baseline and the recent window. We turn each into proportions (so the two windows are comparable even at different volumes), then measure how far apart the two distributions are with total-variation distance — half the sum of absolute differences in each category’s share, a clean number in where 0 is identical and 1 is completely disjoint. We also explicitly check for new categories that didn’t exist in the baseline at all, because a brand-new topic is the sharpest drift signal there is.
import warnings
warnings.filterwarnings("ignore")

# Category counts of the topics users asked about, in two windows.
baseline_topics = {"auth": 40, "ratelimits": 25, "plans": 20, "errors": 10, "backups": 5}
recent_topics   = {"auth": 22, "ratelimits": 18, "plans": 14, "errors": 8,  "backups": 4, "billing": 34}

def to_proportions(counts):
    total = sum(counts.values())
    return {k: v / total for k, v in counts.items()}

def total_variation(p, q):
    cats = set(p) | set(q)
    return 0.5 * sum(abs(p.get(c, 0.0) - q.get(c, 0.0)) for c in cats)

def new_categories(baseline, recent):
    return sorted(set(recent) - set(baseline))

p_base, p_recent = to_proportions(baseline_topics), to_proportions(recent_topics)
tvd = total_variation(p_base, p_recent)
new_cats = new_categories(baseline_topics, recent_topics)
new_share = sum(recent_topics[c] for c in new_cats) / sum(recent_topics.values())

TVD_THRESHOLD = 0.15
input_drift = tvd > TVD_THRESHOLD or len(new_cats) > 0

print(f"total variation distance : {round(tvd, 4)}  (threshold {TVD_THRESHOLD})")
print(f"new categories in recent : {new_cats}")
print(f"share of recent traffic in new topics : {round(new_share, 4)}")
print(f"INPUT DRIFT FLAGGED : {input_drift}")
total variation distance : 0.34 (threshold 0.15)
new categories in recent : ['billing']
share of recent traffic in new topics : 0.34
INPUT DRIFT FLAGGED : TrueThe number to sit with is 0.34. More than a third of the recent window’s questions are about billing — a topic that did not exist in the baseline and that Docent’s golden set therefore does not cover at all. Docent might be answering those questions badly and your offline evaluation would never know, because your evaluation still runs on the old auth-heavy distribution. That’s the danger of input drift: it doesn’t make your metrics look bad, it makes them irrelevant, because they’re measuring a shrinking slice of what’s actually happening. The fix isn’t to roll anything back — it’s to notice billing arrived and get it into your golden set (which loops right back to Module 5’s “production logs become tomorrow’s test cases”). Because this is pure arithmetic over fixed counts, the number is exactly 0.34 every run — no model call, nothing to vary.
Now the right panel. Suppose a prompt change shipped between two windows, and we have per-item judge scores in from a canary that sampled live answers on each side of it (Module 3’s judge produced these; here we hold them fixed so the detector is reproducible). We compare the two windows’ means, flag a regression when the drop exceeds a threshold, and then — because a mean drop on a small sample could be luck — confirm it with a two-proportion z-test on the pass rate (treating a score of at least 0.8 as a “pass”). A large says the drop is bigger than sampling noise would plausibly produce.
# Per-item judge scores in [0, 1] for two windows: before and after a prompt change.
baseline_scores = [0.9, 0.8, 1.0, 0.7, 0.9, 0.8, 1.0, 0.9, 0.8, 0.9,
                   1.0, 0.7, 0.9, 0.8, 0.9, 1.0, 0.8, 0.9, 0.7, 0.9]
recent_scores   = [0.7, 0.6, 0.8, 0.5, 0.7, 0.6, 0.9, 0.7, 0.6, 0.5,
                   0.8, 0.6, 0.7, 0.5, 0.6, 0.8, 0.7, 0.6, 0.5, 0.7]

def mean(xs):
    return sum(xs) / len(xs)

def pass_rate(xs, bar=0.8):
    passes = sum(1 for x in xs if x >= bar)
    return passes, len(xs), passes / len(xs)

def two_proportion_z(x1, n1, x2, n2):
    p1, p2 = x1 / n1, x2 / n2
    p_pool = (x1 + x2) / (n1 + n2)
    se = (p_pool * (1 - p_pool) * (1 / n1 + 1 / n2)) ** 0.5
    return 0.0 if se == 0 else (p1 - p2) / se

base_mean, recent_mean = mean(baseline_scores), mean(recent_scores)
drop = base_mean - recent_mean
DROP_THRESHOLD = 0.05
regression = drop > DROP_THRESHOLD

b_pass, b_n, b_rate = pass_rate(baseline_scores)
r_pass, r_n, r_rate = pass_rate(recent_scores)
z = two_proportion_z(b_pass, b_n, r_pass, r_n)

print(f"baseline window : n={b_n} mean={round(base_mean, 4)} pass_rate={round(b_rate, 4)}")
print(f"recent window   : n={r_n} mean={round(recent_mean, 4)} pass_rate={round(r_rate, 4)}")
print(f"mean drop        : {round(drop, 4)}  (threshold {DROP_THRESHOLD})")
print(f"REGRESSION FLAGGED : {regression}")
print(f"two-proportion z : {round(z, 4)}  (|z| > 1.96 ~ significant at 95%)")
print(f"SIGNIFICANT DROP : {abs(z) > 1.96 and r_rate < b_rate}")

# A small window that only wobbled: same threshold must NOT fire.
noisy_baseline = [0.9, 0.8, 1.0, 0.7, 0.9]
noisy_recent   = [0.8, 0.9, 0.7, 0.9, 0.8]
n_drop = mean(noisy_baseline) - mean(noisy_recent)
print(f"small-window drop : {round(n_drop, 4)}  -> regression flagged: {n_drop > DROP_THRESHOLD}")
baseline window : n=20 mean=0.865 pass_rate=0.85
recent window : n=20 mean=0.655 pass_rate=0.2
mean drop : 0.21 (threshold 0.05)
REGRESSION FLAGGED : True
two-proportion z : 4.1161 (|z| > 1.96 ~ significant at 95%)
SIGNIFICANT DROP : True
small-window drop : 0.04 -> regression flagged: FalseThe mean fell from 0.865 to 0.655 — a drop of 0.21, four times the threshold — and the pass rate collapsed from 85% to 20%. The two-proportion z of 4.12 is far past 1.96, so this is not sampling luck; something real happened, and since we know a prompt change shipped between the windows, it’s a regression we can go roll back. The last two lines are the whole point of the significance check: a small five-item window that merely jiggled produced a drop of 0.04, under the threshold, and correctly did not fire. That’s the discipline — a threshold to ignore tiny moves, and a significance check to make sure a flagged move is bigger than noise. Every number here is deterministic arithmetic over fixed lists, so it prints identically on every run.
Thresholds and significance are two different guards — you want both
They protect against opposite mistakes. A threshold (drop > 0.05) is a practical-significance guard: it stops you from paging on a 0.005 move that’s real but too small to care about. A significance check () is a statistical-significance guard: it stops you from paging on a big-looking move that’s really just five noisy samples. A drop can clear one and fail the other — a huge drop on n=3 is over the threshold but not significant; a tiny drop on n=100000 is significant but under the threshold. Requiring both — a move large enough to matter and unlikely to be noise — is what keeps a monitor from crying wolf while still catching the real regressions.
Both detectors hinge on choices — the TVD threshold, the score-drop threshold, the pass bar, the window size — and those choices trade sensitivity against false alarms. Set the drop threshold too low (0.005) and normal day-to-day wobble trips it constantly, your team learns to ignore the alerts, and the one real regression gets ignored with them. Set it too high (0.30) and Docent can degrade badly before anything fires. The same tension governs window size: a short recent window reacts fast but is noisy (few samples), while a long window is stable but sluggish to notice a sudden regression.
There’s no universal right answer, but there is a right method: set thresholds from your baseline’s own variability. If your baseline mean score bounces around by ±0.03 week to week when nothing has changed, a 0.03 threshold is pure noise — pick something comfortably above that natural wobble (0.05–0.08). And always pair the threshold with the significance check from the last section, so that even when a threshold is crossed, a tiny-sample fluke doesn’t page anyone. The goal is an alarm that stays quiet through normal variation and fires reliably on a real shift — which is exactly the behavior the small-window drop : 0.04 -> False line demonstrated.
You’re monitoring Docent’s mean judge score. The baseline window (n=200) has mean 0.84. Three separate recent windows come in: (a) n=200, mean 0.80; (b) n=6, mean 0.63; (c) n=200, mean 0.835. Using a drop threshold of 0.05, say for each whether the threshold fires, then reason about whether you’d actually page someone once you also consider sample size. Which of the three is the clearest true regression, and which is the most likely false alarm?
Hint
Compute the drop for each: (a) 0.84 − 0.80 = 0.04, under 0.05 — threshold does not fire; (b) 0.84 − 0.63 = 0.21, over threshold, but n=6 is tiny, so a significance check would likely say “could be noise” — investigate, don’t page yet; (c) 0.84 − 0.835 = 0.005, nowhere near threshold — ignore. The clearest real regression is (a)-versus-nothing? No — (a) is under threshold on a large sample, which is the subtle case: a small-but-real drop on n=200. The honest answer is that (b) has the biggest drop but the least evidence (tiny n), (a) has a modest drop with lots of evidence, and (c) is noise. This is exactly why threshold and significance both matter: size of the move and amount of evidence are different questions.
Docent refuses with “I don’t have that in the docs.” A climbing refusal rate can signal retrieval drift (the right pages stopped being surfaced). Given baseline_refusals = 8 out of baseline_total = 200 and recent_refusals = 44 out of recent_total = 200, compute both refusal rates and reuse the two_proportion_z function from this lesson to test whether the rise is significant. Would you flag retrieval drift?
Hint
Baseline rate = 8/200 = 0.04; recent rate = 44/200 = 0.22 — a big jump. Call two_proportion_z(recent_refusals, recent_total, baseline_refusals, baseline_total) (put recent first so a rise gives a positive z) and compare abs(z) to 1.96. You’ll get a z well above 1.96, so yes — flag it as significant and investigate retrieval, because Docent saying “I don’t know” far more often usually means the retriever stopped finding the relevant Meridian pages, not that users suddenly asked harder questions. Note this is the mirror image of the score-drop test: same z-function, but here a higher recent number is the bad direction.
For each scenario, decide whether it’s input drift, quality/behavior drift, or a regression, and name the one signal from this lesson you’d look at to confirm it: (a) Docent’s mean score was flat for a month, then dropped sharply the same afternoon a new prompt was deployed. (b) Over eight weeks, the share of questions about plans and billing slowly rose from 10% to 45% while auth questions faded. (c) No deploy happened, but the mean score has slid gradually over three weeks and the refusal rate is creeping up. Explain your reasoning for the trickiest one.
Hint
(a) is a regression — a step change aligned to a deploy; confirm by lining the score elbow up against the deploy log and comparing the before/after windows with the two-proportion check. (b) is input drift — a gradual shift in the input distribution; confirm with the total-variation distance and the new-category check over the topic buckets. (c) is the tricky one: no deploy rules out a prompt/version regression, and the gradual slope plus rising refusals points to quality drift driven by drifting retrieval — likely a slowly staleness-rotting index surfacing the wrong pages; confirm by canary-sampling recent answers with the judge and inspecting retrieved_ids on the refusals. The tell is “no deploy but a slope, not an elbow” — that’s drift, not regression.
Quality in production rarely fails loudly — it decays, and catching decay means comparing a recent window against a trusted baseline and deciding whether the difference is real. Name the change first: input/data drift (the questions moved and your golden set no longer covers them), quality/behavior drift (the answers got worse), or prompt/version drift (the system changed underneath you); and distinguish a regression — a step change you can align to a deploy and roll back — from drift — a gradual slope with no single cause that you have to adapt to. Detect it by comparing metric windows, monitoring the input distribution for new topics, canary-sampling live outputs with a judge, and watching cheap proxies like refusal and thumbs-down rates. You built both halves deterministically: an input-drift detector that flagged a billing surge with a total-variation distance of 0.34 (a brand-new topic taking 34% of recent traffic), and a quality-regression detector that flagged a windowed mean score dropping from 0.865 to 0.655 — a 0.21 fall past the 0.05 threshold, confirmed by a two-proportion z of 4.12 — while correctly not firing on a five-item window that only wobbled by 0.04.
The regressions that hurt most in production are invisible to the monitors you built for ordinary services. A Friday prompt tweak that drops a fifth of Docent’s answer quality throws no exception, returns HTTP 200, and keeps p95 latency flat — the only evidence is that the recent window’s scores are lower than last week’s, and you only see it if you’re comparing windows and know how to tell a real shift from noise. Input drift is subtler still: it doesn’t make your metrics look bad, it makes them irrelevant, quietly measuring a shrinking slice of traffic while a new billing topic Docent was never evaluated on takes over. The discipline in this lesson — baseline versus recent, a threshold to skip the trivial, a significance check to skip the noise — is what turns “users say Docent feels worse lately” into “the recent window’s pass rate fell from 85% to 20%, z=4.12, aligned to yesterday’s deploy: roll it back.” That is the difference between finding a regression yourself in an hour and having a customer find it for you in a week.
You can now tell the three ways Docent can silently get worse apart — the questions drifting away from your test set, the answers degrading, or the system changing under you — and separate a gradual drift from a sudden, attributable regression. More importantly, you built the detectors: a distribution-shift check that caught a billing surge your golden set never covered, and a windowed score comparison that caught a prompt-change regression and confirmed it was signal, not noise, with a two-proportion z. The through-line is comparison against a trusted baseline, guarded by a threshold and a significance check so the alarm is both sensitive and quiet. Lesson 3 takes this comparison out of the dashboard and into your pipeline: you’ll run your golden-set evaluation as a regression test in CI, so a prompt or model change that would drop quality fails the build and never reaches the users you’ve been monitoring here.
Keep DATATWEETS free. Help fund practical data, AI, and engineering lessons for learners worldwide.
