Title here
Summary here
Every lesson so far used small, hand-written data to keep the focus on one idea at a time. This lesson is different: it introduces the real, full Thistlewood Goods dataset — the one every remaining module in this course reuses — and then puts you to work on a genuine first analysis: how much did Thistlewood Goods actually make in its first quarter, month by month, and which categories drove it?
By the end of this lesson, you will be able to:
Thistlewood Goods is a small home-goods retailer — the running example for this entire course — selling kitchenware, bath goods, bedding, lighting, storage, decor, furniture, and outdoor items. Its history lives across six real, generated tables, built once with a fixed random seed (42) so every number in this course stays exactly reproducible. Every later module reuses these same files rather than regenerating them.
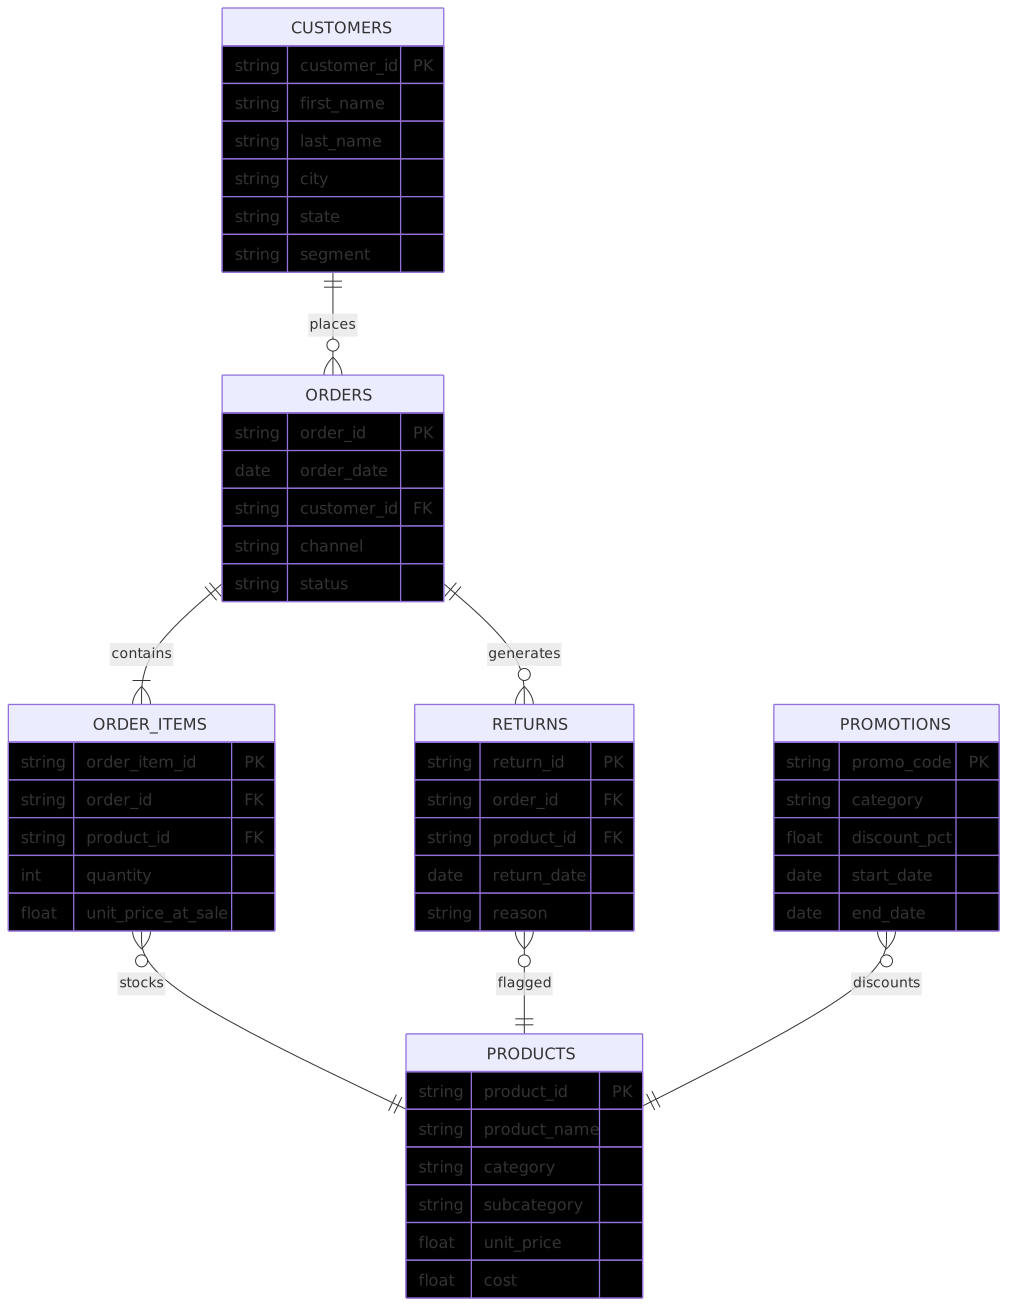
thistlewood_customers.csv — 180 customers, retail and wholesale, with city, state, and signup date.thistlewood_products.csv — 60 products across 8 categories (Kitchen, Bath, Bedding, Lighting, Storage, Decor, Furniture, Outdoor), with price, cost, and supplier.thistlewood_orders.csv — 6,000 orders from 2024-01-01 through 2025-12-31, with channel (web, store, phone) and status (completed, cancelled, pending).thistlewood_order_items.csv — 14,054 order line items, 1 to 4 per order, with quantity and the actual price charged.thistlewood_returns.csv — 450 returns, about 7.5% of orders, with a reason and returned quantity.thistlewood_promotions.csv — 25 category- or product-level promotions with a discount percentage and an active date range.Every file above is hosted individually at https://datatweets.com/datasets/thistlewood/<filename> (for example, https://datatweets.com/datasets/thistlewood/thistlewood_customers.csv) — there’s no browsable directory listing at the parent path, so link to a specific file rather than the folder. All six were generated together by a single seeded script, generate_thistlewood_data.py (hosted the same way, alongside the CSVs), which you can inspect but don’t need to run yourself: the data is already there, and its keys are fully consistent — every product_id an order line references really exists in thistlewood_products.csv, every order_id a return references really exists in thistlewood_orders.csv, and so on.
Why not use all six tables in Lesson 5?
Joining tables together is its own skill, taught properly starting in Module 8. This lesson deliberately works with one already-joined file instead, so you can focus entirely on reading and summarizing — exactly the read/filter/aggregate/print shape from Lesson 4, just on real data instead of 12 hand-written rows.
thistlewood_orders_flat.csvFor this guided project, Thistlewood Goods’ first quarter (January through March 2024) of completed orders has already been joined into one flat file — customer names and product details included — hosted at https://datatweets.com/datasets/thistlewood/thistlewood_orders_flat.csv. Download it into the data/raw/ folder Lesson 3 set up:
# gate: skip
from pathlib import Path
from urllib.request import urlretrieve

url = "https://datatweets.com/datasets/thistlewood/thistlewood_orders_flat.csv"
path = Path("data/raw/thistlewood_orders_flat.csv")
path.parent.mkdir(parents=True, exist_ok=True)
urlretrieve(url, path)
print(f"downloaded {path}")
Every code block below reads it by filename alone, the way you’d run it with your terminal already sitting inside data/raw/ (or adjust the path to wherever you saved it):
import polars as pl

PATH = "thistlewood_orders_flat.csv"
orders_flat = pl.read_csv(PATH)

print(f"read {orders_flat.height} rows, {orders_flat.width} columns from {PATH}")
print(orders_flat.schema)
print(orders_flat.head(3))
read 1749 rows, 8 columns from thistlewood_orders_flat.csv
Schema({'order_id': String, 'order_date': String, 'customer_name': String, 'product_name': String, 'category': String, 'quantity': Int64, 'unit_price': Float64, 'total': Float64})
shape: (3, 8)
┌──────────┬────────────┬───────────────┬───────────────────┬───────────┬──────────┬────────────┬─────────┐
│ order_id ┆ order_date ┆ customer_name ┆ product_name ┆ category ┆ quantity ┆ unit_price ┆ total │
│ --- ┆ --- ┆ --- ┆ --- ┆ --- ┆ --- ┆ --- ┆ --- │
│ str ┆ str ┆ str ┆ str ┆ str ┆ i64 ┆ f64 ┆ f64 │
╞══════════╪════════════╪═══════════════╪════════════════════╪═══════════╪══════════╪════════════╪═════════╡
│ O00588 ┆ 2024-01-01 ┆ Benjamin ┆ Hand-Glazed ┆ Storage ┆ 1 ┆ 271.08 ┆ 271.08 │
│ ┆ ┆ Norwood ┆ Laundry Basket ┆ ┆ ┆ ┆ │
│ O00588 ┆ 2024-01-01 ┆ Benjamin ┆ Hand-Glazed ┆ Storage ┆ 3 ┆ 193.81 ┆ 581.43 │
│ ┆ ┆ Norwood ┆ Stackable Bin ┆ ┆ ┆ ┆ │
│ O00588 ┆ 2024-01-01 ┆ Benjamin ┆ Charcoal ┆ Furniture ┆ 4 ┆ 34.75 ┆ 139.0 │
│ ┆ ┆ Norwood ┆ Entry Bench ┆ ┆ ┆ ┆ │
└──────────┴────────────┴───────────────┴────────────────────┴───────────┴──────────┴────────────┴─────────┘1,749 rows, each one a single line item — one product, from one order, at the price it actually sold for. The same order_id appears more than once when an order had multiple line items, exactly like O00588 above, which had four different products in a single order.
The simplest real question: how much revenue did this quarter of completed orders bring in?
total_revenue = orders_flat["total"].sum()
n_orders = orders_flat["order_id"].n_unique()

print(f"total revenue: ${total_revenue:,.2f}")
print(f"unique orders: {n_orders:,}")
print(f"line items: {orders_flat.height:,}")
print(f"date range: {orders_flat['order_date'].min()} to {orders_flat['order_date'].max()}")
total revenue: $1,171,856.43
unique orders: 733
line items: 1,749
date range: 2024-01-01 to 2024-03-31733 distinct completed orders across the quarter, made up of 1,749 line items, brought in $1,171,856.43.
Revenue for the whole quarter is a start; the real question a business asks next is whether that revenue is steady, growing, or shrinking month to month. order_date is stored as plain text ("2024-01-01"), and the first 7 characters of any date in that format are exactly its year and month — pl.col("order_date").str.slice(0, 7) extracts that directly, no date-parsing library needed yet (Module 9 covers proper date types in depth):
orders_per_month = (
    orders_flat
    .with_columns(pl.col("order_date").str.slice(0, 7).alias("month"))
    .select("order_id", "month")
    .unique()
    .group_by("month")
    .agg(pl.len().alias("orders"))
    .sort("month")
)
print(orders_per_month)
shape: (3, 2)
┌─────────┬────────┐
│ month ┆ orders │
│ --- ┆ --- │
│ str ┆ u32 │
╞═════════╪════════╡
│ 2024-01 ┆ 256 │
│ 2024-02 ┆ 225 │
│ 2024-03 ┆ 252 │
└─────────┴────────┘Notice the .select("order_id", "month").unique() step before grouping: orders_flat has one row per line item, so counting rows directly would count a four-item order four times. Reducing to unique (order_id, month) pairs first, then grouping, counts each order exactly once — 256 orders in January, dipping to 225 in February, then recovering to 252 in March.
Finally, which categories actually drove that $1,171,856.43?
top_categories = (
    orders_flat
    .group_by("category")
    .agg(pl.col("total").sum().round(2).alias("revenue"), pl.len().alias("line_items"))
    .sort("revenue", descending=True)
)
print(top_categories)
shape: (8, 3)
┌───────────┬───────────┬────────────┐
│ category ┆ revenue ┆ line_items │
│ --- ┆ --- ┆ --- │
│ str ┆ f64 ┆ u32 │
╞═══════════╪═══════════╪════════════╡
│ Bath ┆ 223675.54 ┆ 252 │
│ Kitchen ┆ 175419.73 ┆ 229 │
│ Decor ┆ 160471.86 ┆ 196 │
│ Lighting ┆ 156510.09 ┆ 237 │
│ Bedding ┆ 156496.8 ┆ 206 │
│ Furniture ┆ 109213.14 ┆ 212 │
│ Storage ┆ 106618.04 ┆ 216 │
│ Outdoor ┆ 83451.23 ┆ 201 │
└───────────┴───────────┴────────────┘Bath leads at $223,675.54, ahead of Kitchen at $175,419.73, even though Bath doesn’t have the most line items (252, versus Lighting’s 237 and Kitchen’s 229) — a reminder that revenue and volume don’t always rank the same way, and that “top category” needs a defined metric before it means anything.
Using orders_flat, compute the average total value of a completed order in this quarter (hint: you need order-level totals first, summing total per order_id, before you can average across orders — averaging line-item total directly would answer a different, smaller-sounding question). Report the number you get.
Hint
orders_flat.group_by("order_id").agg(pl.col("total").sum().alias("order_total")) gives you one row per order; .select(pl.col("order_total").mean()) finishes it from there.
Find which single month (January, February, or March 2024) had the highest Kitchen-category revenue. You’ll need both the month extraction from Question 2 and a filter for category == "Kitchen" before aggregating.
This lesson introduced the real, six-table Thistlewood Goods dataset this entire course reuses, then worked a genuine first analysis against its pre-joined Q1 2024 file: 733 completed orders, 1,749 line items, and $1,171,856.43 in real revenue, broken down by month (256, 225, then 252 orders) and by category (Bath leading at $223,675.54). Every number came from pl.read_csv, .filter, .group_by, and .agg — the exact same four moves from Lesson 4, just answering three real business questions instead of one small demonstration.
.str.slice(0, 7) — a simple way to pull a fixed-width prefix (here, YYYY-MM) out of a text date column without a dedicated date type.“Read a CSV and summarize it” sounds almost too simple to be a real skill, but it’s the actual shape of an enormous share of real data work: a stakeholder asks a plain business question, and the honest answer requires reading the right file, keeping the right rows, grouping correctly, and reporting a number you can stand behind. You just did that three times, for real, in one lesson.
Module 1 is complete — you’ve gone from “why does this tool exist” to a genuine, multi-question analysis of real Thistlewood Goods data. Module 2 goes underneath the DataFrame itself: what a Series actually is, how schemas and dtypes work, and the no-index model in full, using the same six-table dataset you just met.
Keep DATATWEETS free. Help fund practical data, AI, and engineering lessons for learners worldwide.
