Title here
Summary here
Module 2 left CityFlow with a sharp, uncomfortable fact and a promissory note. In Transformations vs Actions you built the zone-hour report as a lazy pipeline and then asked it four questions — and Spark answered each one by re-running the entire pipeline from the parquet files up. The identical count() executed twice, start to finish; the totals action ran everything a third time; show(5) a fourth. The reason was structural, not a bug: a DataFrame is a plan, and executing a plan produces an answer, not a stored copy of the data along the way. We named the fix — cache() — and promised it to Module 5, “where its costs get measured as honestly as its benefits.” This is Module 5. The note is due.
So far this module has been about shaping physical execution — how many partitions, narrow versus wide, what a shuffle costs. Caching is the one lever that changes a different axis entirely: not how the work runs, but how many times. This lesson builds the expensive artifact of the whole module — the zone-hour base, a window filter and hour truncation feeding the group-by shuffle, joined to the zone dimension — and drives three actions across it. Without a cache you will watch it rebuild three times for 2.92 s of repeated work; with one cache() call it materializes once and the next two actions read from memory, for 1.88 s and a 1.56× win. Then the honest half, because caching is not free: a single-action workload where the cache saves nothing and costs a materialization pass, and a frame too big to fit that answers cache() with an OutOfMemoryError. The rule that falls out is short — cache when it is reused and it fits — and every number under it is measured.
By the end of this lesson, you will be able to:
cache() (equivalently persist(StorageLevel.MEMORY_AND_DISK)) to materialize a reused DataFrame once, and measure the real speedup — 2.92 s to 1.88 s across three actions hereInMemoryTableScan over an InMemoryRelation, and confirm cache() is itself lazy (is_cached True at once, materialized on the first action)OutOfMemoryError — and state when not to cacheunpersist() and spark.catalog.clearCache(), and read df.storageLevel and the MEMORY_ONLY / MEMORY_AND_DISK / DISK_ONLY menuYou’ll need pyspark with the JDK configured as in Module 1, Lesson 3, and the zone lookup CSV alongside the three monthly parquet files. Start the session.
Same session shape as every lesson — named, local, quiet:
import warnings
warnings.filterwarnings("ignore")
import time

from pyspark.sql import SparkSession, functions as F
from pyspark import StorageLevel

spark = (SparkSession.builder
         .appName("cityflow")
         .master("local[*]")
         .config("spark.ui.showConsoleProgress", "false")
         .getOrCreate())
spark.sparkContext.setLogLevel("ERROR")
print("Spark", spark.version, "-", spark.sparkContext.defaultParallelism, "task slots")
Spark 4.2.0 - 10 task slotsNow we need a genuinely expensive DataFrame — expensive enough that recomputing it hurts. The zone-hour base is exactly that, and it also lets us cross-check against Course 1. Read the three months and the 265-row zone dimension, spending the session’s one-time JVM warmup on an untimed throwaway read as Module 2 taught:
months = ["yellow_tripdata_2024-01.parquet",
          "yellow_tripdata_2024-02.parquet",
          "yellow_tripdata_2024-03.parquet"]

spark.read.parquet(*months).count()   # untimed warm-up: JVM I/O + OS page cache

trips = spark.read.parquet(*months)
zones = (spark.read.option("header", True).option("inferSchema", True)
         .csv("taxi_zone_lookup.csv"))
print("zone dimension rows:", zones.count())
zone dimension rows: 265Here is the base itself: the module’s canonical shuffle (group by zone and hour, count trips and sum revenue over 9.5 million rows) with a broadcast join to the zone dimension on top, so each bucket carries its zone name and borough. It’s a function so we can build fresh, independent copies of the same plan later. Building it is a transformation — nothing runs yet — but we spend one untimed warm-up action so the timings that follow measure execution, not first-touch compilation:
def zone_hour_base(t, z):
    agg = (t.filter((F.col("tpep_pickup_datetime") >= "2024-01-01") &
                    (F.col("tpep_pickup_datetime") < "2024-04-01"))
            .withColumn("hour", F.date_trunc("hour", F.col("tpep_pickup_datetime")))
            .groupBy("PULocationID", "hour")
            .agg(F.count("*").alias("trips"),
                 F.sum("total_amount").alias("revenue")))
    return (agg.join(z, agg.PULocationID == z.LocationID, "inner")
               .select("PULocationID", "Zone", "Borough", "hour", "trips", "revenue"))

base = zone_hour_base(trips, zones)
base.count()   # untimed warm-up
print("base is a", type(base).__name__, "- window + shuffle-aggregate + broadcast join")
base is a DataFrame - window + shuffle-aggregate + broadcast joinNow the moment Module 2 warned about, measured on a real multi-action workload. We ask base three ordinary questions — how many buckets, what are the totals, which are the busiest — timing each:
t0 = time.perf_counter(); n = base.count(); t_count = time.perf_counter() - t0
t0 = time.perf_counter()
tot = base.agg(F.sum("trips").alias("t"), F.sum("revenue").alias("r")).first()
t_sum = time.perf_counter() - t0
t0 = time.perf_counter()
top = base.orderBy(F.col("trips").desc()).limit(5).collect()
t_top = time.perf_counter() - t0
uncached = t_count + t_sum + t_top

print(f"count()  -> {n:,} buckets            in {t_count:.2f} s")
print(f"agg sum  -> {tot['t']:,} trips  ${tot['r']:,.2f}  in {t_sum:.2f} s")
print(f"top-5    -> zone {top[0]['PULocationID']} {top[0]['Zone']} {top[0]['trips']} trips  in {t_top:.2f} s")
print(f"THREE ACTIONS, NO CACHE (pipeline runs 3x): {uncached:.2f} s")
count() -> 240,917 buckets in 0.77 s
agg sum -> 9,554,757 trips $256,692,373.14 in 1.09 s
top-5 -> zone 79 East Village 846 trips in 1.05 s
THREE ACTIONS, NO CACHE (pipeline runs 3x): 2.92 sRead those three lines as three complete executions of the pipeline. The count() scanned the parquet, filtered 9.5 million rows to the window, truncated to the hour, shuffled and aggregated into 240,917 groups, and broadcast-joined the zone dimension — then threw all of it away and handed Python a single integer. The agg did the entire thing again to produce two sums. The top-5 did it a third time to sort and take five rows. Three answers, three full pipelines, 2.92 s — and the numbers are right: 240,917 buckets, 9,554,757 trips, $256,692,373.14, and East Village at 1 a.m. on that February Sunday, exactly the busiest bucket Module 2 surfaced. Every one of those results was recomputed from the same unchanging source. That is the bill caching exists to stop paying.
The instruction that changes this is one method. cache() marks a DataFrame so that the first time an action materializes it, Spark keeps the result — the finished 240,917-row base — and every later action reads that stored copy instead of rebuilding it. In modern Spark, cache() is exactly persist(StorageLevel.MEMORY_AND_DISK): keep it in memory, spill any overflow to disk.
The critical subtlety, and the reason it doesn’t contradict Module 2’s laziness lesson, is that cache() is itself lazy. Calling it doesn’t compute anything — it sets a flag. Watch:
cached_base = zone_hour_base(trips, zones).cache()
print("is_cached immediately after .cache():", cached_base.is_cached)
print("storageLevel:", cached_base.storageLevel)
is_cached immediately after .cache(): True
storageLevel: Disk Memory Deserialized 1x Replicatedis_cached is True the instant we call .cache() — the DataFrame is marked for caching — but no rows have been stored yet, because no action has run. The storage level, Disk Memory Deserialized 1x Replicated, is what cache() requests for a DataFrame: memory first, disk for overflow, held in Spark’s own uncompressed columnar form (that “Deserialized” flag matters — we’ll return to it under storage levels). Now run the same three actions and watch the shape change:
t0 = time.perf_counter(); n = cached_base.count(); t_count = time.perf_counter() - t0
t0 = time.perf_counter()
tot = cached_base.agg(F.sum("trips").alias("t"), F.sum("revenue").alias("r")).first()
t_sum = time.perf_counter() - t0
t0 = time.perf_counter()
top = cached_base.orderBy(F.col("trips").desc()).limit(5).collect()
t_top = time.perf_counter() - t0
cached = t_count + t_sum + t_top

print(f"count()  (materializes the cache) in {t_count:.2f} s")
print(f"agg sum  (reads from memory)      in {t_sum:.2f} s")
print(f"top-5    (reads from memory)      in {t_top:.2f} s")
print(f"THREE ACTIONS, CACHED (pipeline runs 1x): {cached:.2f} s")
print(f"SPEEDUP: {uncached/cached:.2f}x  ({uncached:.2f} s -> {cached:.2f} s)")
count() (materializes the cache) in 1.42 s
agg sum (reads from memory) in 0.31 s
top-5 (reads from memory) in 0.15 s
THREE ACTIONS, CACHED (pipeline runs 1x): 1.88 s
SPEEDUP: 1.56x (2.92 s -> 1.88 s)Three things in those numbers, and each teaches part of the lesson.
The first action got slower, not faster. The cached count() took 1.42 s against the uncached 0.77 s — nearly double. That is not noise; it is the honest cost of caching made visible. This action did everything the uncached count did plus wrote all 240,917 rows into the in-memory column store. Materializing a cache is real work, and you pay it on the first action, always.
The next two actions collapsed. The agg sum dropped from 1.09 s to 0.31 s, and the top-5 from 1.05 s to 0.15 s — roughly 3.5× and 7× faster. They no longer scan parquet, filter 9.5 million rows, shuffle, or join. They read the finished base straight from memory. This is the win: not the file read, which was cheap already, but the whole window-shuffle-join recompute, avoided.
The total is a 1.56× win, and honesty about its size matters. On a beefier reused pipeline the ratio climbs; on this 160 MB job on one laptop it’s a modest 1.56×, because the recompute we’re skipping — though real — isn’t enormous, and the input parquet was already sitting in the OS page cache, so re-reading the bytes was never the expensive part. The recompute avoided is the join and the shuffle-aggregate, not the disk read. The ratio grows with the number of reuses: three actions gave 1.56×; ten actions on the same cached base would approach the full recompute-elimination limit. Exact seconds wobble run to run — run this yourself and you’ll see different numbers — but the shape is invariant: one slow materializing action, then cheap reads.
You don’t have to trust the timings — the plan shows the cache explicitly. Call explain() on the cached base:
cached_base.explain()== Physical Plan ==
AdaptiveSparkPlan isFinalPlan=false
+- InMemoryTableScan [PULocationID#49, Zone#80, Borough#79, hour#173, trips#174L, revenue#175]
+- InMemoryRelation [PULocationID#49, Zone#80, Borough#79, hour#173, trips#174L, revenue#175], StorageLevel(disk, memory, deserialized, 1 replicas)
+- AdaptiveSparkPlan isFinalPlan=true
+- == Final Plan ==
ResultQueryStage 2
+- *(3) Project [PULocationID#49, Zone#80, Borough#79, hour#173, trips#174L, revenue#175]
+- *(3) BroadcastHashJoin [PULocationID#49], [LocationID#78], Inner, BuildRight, false, false
:- *(3) HashAggregate(keys=[PULocationID#49, hour#173], functions=[count(1), sum(total_amount#58)])
: +- ShuffleQueryStage 0
: +- Exchange hashpartitioning(PULocationID#49, hour#173, 200), ENSURE_REQUIREMENTS, [plan_id=857]
: +- *(1) HashAggregate(keys=[PULocationID#49, hour#173], functions=[partial_count(1), partial_sum(total_amount#58)])
: +- *(1) Project [PULocationID#49, total_amount#58, date_trunc(hour, cast(tpep_pickup_datetime#43 as timestamp), Some(Asia/Tehran)) AS hour#173]
: +- *(1) Filter ((isnotnull(tpep_pickup_datetime#43) AND (... < 2024-04-01 00:00:00)) AND isnotnull(PULocationID#49))
: +- *(1) ColumnarToRow
: +- FileScan parquet [tpep_pickup_datetime#43,PULocationID#49,total_amount#58] ... Location: InMemoryFileIndex(3 paths)[...], PushedFilters: [IsNotNull(tpep_pickup_datetime), ...]
+- BroadcastQueryStage 1
+- BroadcastExchange HashedRelationBroadcastMode(...), [plan_id=878]
+- *(2) Filter isnotnull(LocationID#78)
+- FileScan csv [LocationID#78,Borough#79,Zone#80] ... Location: InMemoryFileIndex(1 paths)[...]
+- == Initial Plan ==
(the pre-AQE mirror of the same tree, omitted here for length)(Output shown verbatim except the Location: file paths, shortened to [...], a long Filter predicate elided, and the duplicated Initial Plan subtree omitted — yours will show your own directory and the full tree.)
Read it top-down for once, because that’s where the new nodes are. The top operator is now InMemoryTableScan — a read from the cache — sitting over an InMemoryRelation tagged StorageLevel(disk, memory, deserialized, 1 replicas), exactly the level we requested. That InMemoryRelation is the cache itself, and inside it, indented, is the entire original pipeline: the Exchange shuffle, both HashAggregate stages, the BroadcastHashJoin, the FileScan. The whole expensive subtree got folded up and stored behind one scan. When a later action runs, Spark sees InMemoryTableScan at the top and stops — it reads the stored columns and never descends into the tree below. That is the recompute being skipped, drawn in the plan.
And the cache is trustworthy — the stored copy is the same data, to the cent:
gt = cached_base.agg(F.sum("trips").alias("t"), F.sum("revenue").alias("r")).first()
print("cross-check cached base:", f"{gt['t']:,}", "trips", f"${gt['r']:,.2f}")
cross-check cached base: 9,554,757 trips $256,692,373.149,554,757 trips and $256,692,373.14 read back out of the cache — identical to Course 1’s verified zone-hour report and to the uncached run above. Caching changes when and how many times the work happens, never what it produces.
The 1.56× win came because three actions shared one materialization. Take the sharing away and the trade inverts. Build a fresh base, warm it, then time a single count() with and without a cache:
one_plain = zone_hour_base(trips, zones); one_plain.count()   # warm
one_plain = zone_hour_base(trips, zones)
t0 = time.perf_counter(); one_plain.count(); a = time.perf_counter() - t0

one_cached = zone_hour_base(trips, zones).cache()
t0 = time.perf_counter(); one_cached.count(); b = time.perf_counter() - t0
print(f"single action, no cache: {a:.2f} s | with cache (pays materialization): {b:.2f} s")
one_cached.unpersist()
single action, no cache: 0.23 s | with cache (pays materialization): 0.22 sFor a workload with one action, caching bought nothing — the two times are a coin-flip apart — while it did pay to build and hold a column store nobody will ever read again. That is the first honest cost: cache when the result is reused; a cache read exactly once is pure overhead, both in time and in the memory it pins.
The second cost is harder. cache()’s default level, MEMORY_AND_DISK, promises to spill to disk when memory runs short — which sounds like a safety net that makes caching risk-free for any size. It isn’t. To build the in-memory columnar batches, Spark first assembles them in the heap, and only then decides what to spill. Try to cache the raw 9.5-million-row, 19-column frame — far larger than the tidy 240,917×6 base — and on this laptop’s default driver heap it doesn’t spill gracefully; it dies:
# gate: skip -- this OOMs the executor by design; run manually to see the crash, not in the gate
raw = spark.read.parquet(*months).persist(StorageLevel.MEMORY_AND_DISK)
raw.count()   # attempts to materialize the whole wide frame into the column store
26/07/18 00:43:19 ERROR Executor: Exception in task 4.0 in stage 72.0
java.lang.OutOfMemoryError: Java heap space
at org.apache.spark.sql.execution.columnar.BasicColumnBuilder.initialize(ColumnBuilder.scala:68)
at org.apache.spark.sql.execution.columnar.DefaultCachedBatchSerializer$$anon$1.next(InMemoryRelation.scala:133)
at org.apache.spark.storage.memory.MemoryStore.putIteratorAsBytes(MemoryStore.scala:368)
...
py4j.protocol.Py4JJavaError: An error occurred while calling o360.count.
: org.apache.spark.SparkException: Job aborted due to stage failure ... java.lang.OutOfMemoryError: Java heap spaceThat block is marked # gate: skip for a reason — it genuinely crashes the executor, so it must never run inside the shared session — but it is a real result I ran, and the lesson is real with it: MEMORY_AND_DISK is not a license to cache anything. A frame too big to fit doesn’t quietly spill on a small local heap; it can blow up the columnar-batch builder first. The 240,917-row base cached fine because it fits; the raw quarter does not. This is the “and it fits” half of the rule, learned the loud way. Where you must cache something borderline, DISK_ONLY or a serialized level lowers the memory pressure — the next section is that menu.
cache() picks one point on a small grid of trade-offs; persist(StorageLevel...) lets you pick another. The three you’ll reach for most:
print("MEMORY_ONLY     ", StorageLevel.MEMORY_ONLY)
print("MEMORY_AND_DISK ", StorageLevel.MEMORY_AND_DISK, "  (the level cache() names)")
print("DISK_ONLY       ", StorageLevel.DISK_ONLY)
MEMORY_ONLY Memory Serialized 1x Replicated
MEMORY_AND_DISK Disk Memory Serialized 1x Replicated (the level cache() names)
DISK_ONLY Disk Serialized 1x ReplicatedMEMORY_ONLY keeps blocks in memory and simply drops any that don’t fit — a dropped partition is silently recomputed on next read, so an over-full MEMORY_ONLY cache quietly gives back the recompute you were trying to avoid. MEMORY_AND_DISK spills the overflow to disk instead of dropping it — the safer default, and what cache() requests. DISK_ONLY skips memory entirely, trading RAM pressure for slower reads — useful for a frame too big to hold but expensive enough to be worth not recomputing. One honest wrinkle you can see above: these Python StorageLevel constants print as Serialized, while the DataFrame we cached reported Deserialized — the DataFrame API stores its own compressed columnar format rather than the RDD-style serialized bytes these constants describe, so treat the constant as naming the memory-and-disk tier, and trust df.storageLevel for what a given DataFrame actually holds.
Whatever you cache, you should free it when the reuse is over — a cache holds memory until you release it. unpersist() drops one DataFrame’s cache; spark.catalog.clearCache() drops every cached table at once:
cached_base.unpersist()
print("is_cached after unpersist():", cached_base.is_cached)
spark.catalog.clearCache()
print("catalog cleared - all cached tables dropped")
is_cached after unpersist(): False
catalog cleared - all cached tables droppedis_cached flips back to False, and the memory is returned. In a long-running job that caches several intermediates, unpersist()-ing each the moment its last reader has run is the difference between steady memory and a slow climb into the same OutOfMemoryError we saw above — an idle cache is not free, it is pinned RAM.
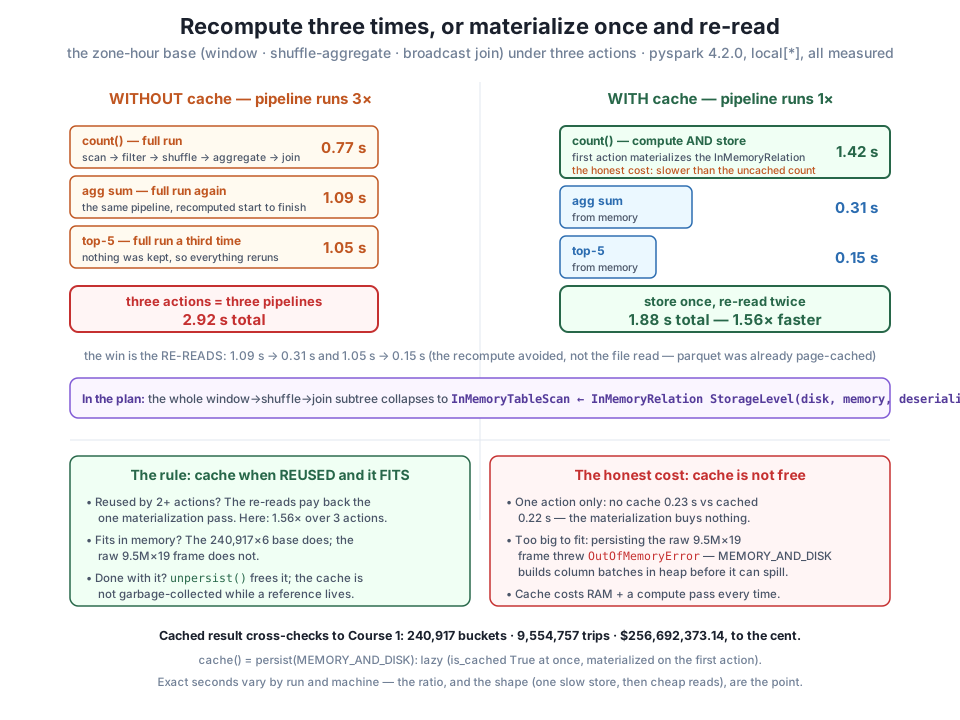
count() 0.77 s, agg sum 1.09 s, top-5 1.05 s, 2.92 s total. With cache() the first action pays to compute and store (1.42 s — slower than the uncached count, the honest materialization cost), then the next two read from memory (0.31 s and 0.15 s), for 1.88 s and a 1.56× win. The plan collapses the whole subtree to InMemoryTableScan over an InMemoryRelation; the cached result still totals 240,917 buckets · 9,554,757 trips · $256,692,373.14. Honest cost: one action saves nothing (0.23 s vs 0.22 s) and the raw 9.5M×19 frame throws OutOfMemoryError. Cache when reused and it fits. Ratios, not exact seconds, are the point.cache() and persist() are the same call, one default apart
df.cache() is literally df.persist() with no argument, and df.persist() with no argument is df.persist(StorageLevel.MEMORY_AND_DISK). So reach for the bare cache() when the default (memory, spilling to disk) is what you want — which is most of the time — and only spell out persist(StorageLevel...) when you have a reason to pick a different point on the grid: DISK_ONLY for a frame too big to hold in RAM, a serialized level to fit more in less memory at some CPU cost. One caution worth internalizing: calling persist() on an already-persisted DataFrame with a different level raises an error rather than re-persisting — unpersist() first if you need to change a cache’s storage level.
Where to cache in a pipeline: at the fork, not the leaf
The place a cache pays is a DataFrame that is expensive to produce and read more than once — a fork in your pipeline, where one derived result feeds several downstream actions. The zone-hour base is exactly that: three questions branch off it. Caching the raw trips read, by contrast, is usually pointless — it’s cheap to re-read from page-cached parquet and often too big to hold, as we saw. The instinct to build is: sketch the pipeline, find the node that (a) more than one action depends on and (b) costs real work to compute, and cache there. Module 5’s guided project (Lesson 5) puts this to work on a three-output job where the fork is obvious and the cache clearly pays.
The session’s work is done — release it:
spark.stop()
print("session stopped")
session stoppedExercise 1 — Watch the cache materialize, then read. Build the zone-hour base fresh, cache() it, and check is_cached before running any action (expect True — marked, not yet stored). Then time three count() calls in a row on it. Which one is slowest, and why? Confirm the last two are far faster than an uncached recompute, and open the Spark UI’s Storage tab (localhost:4040) after the first count to see the cached table appear with its size and fraction-in-memory.
Hint
The first count() is slowest — it both computes the pipeline and writes the 240,917 rows into the column store, so it runs slower than an uncached count would (here 1.42 s vs 0.77 s). Counts two and three read the stored copy and should land in a few tenths of a second. If all three take similar full-pipeline time, your cache() didn’t take effect — check you kept the reference the .cache() returned (b = df.cache()), since df.cache() marks df in place but it’s the returned handle you should reuse. The Storage tab stays empty until the first action; that emptiness is the proof that cache() is lazy.
Exercise 2 — Find the break-even. For a workload with exactly one action, the lesson measured cache saving nothing. Reproduce that, then answer the design question by measurement: build the base once and run it under N actions for N = 1, 2, 3, and 4, timing the total both cached and uncached. At what N does caching start to win, and does the speedup keep growing with N?
Hint
Expect N = 1 to be a wash or a slight loss (you pay materialization, gain nothing), and the cached total to pull clearly ahead from N = 2 upward, with the ratio widening as N grows — because the uncached total grows by a full recompute per action while the cached total grows only by a cheap memory read. Warm up before timing, and time the cached and uncached variants in separate fresh builds so one doesn’t leave a cache the other reads. The exact crossover N shifts with machine and data size; the pattern — cache pays once reuse is 2 or more — is the transferable rule.
Exercise 3 — Pick the storage level honestly. Take the zone-hour base and persist it three ways in separate runs: MEMORY_ONLY, MEMORY_AND_DISK, and DISK_ONLY. For each, print df.storageLevel, materialize with a count(), then time a second count(). Which level reads back fastest, and which would you choose if the base were ten times larger than your free memory? Then try persist()-ing an already-persisted DataFrame at a second level and read the error.
Hint
On a base that comfortably fits, the memory-holding levels read back fastest and DISK_ONLY a touch slower — but the ranking inverts the moment the data exceeds memory: MEMORY_ONLY starts silently dropping and recomputing partitions, so for the ten-times-too-large case DISK_ONLY (or MEMORY_AND_DISK) is the honest choice. Re-persisting at a new level without unpersist()-ing first raises “Cannot overwrite storage level” — Spark refuses to change a live cache’s level under you; drop it and re-persist. Remember to unpersist() between runs so each measures a clean cache, not a leftover one.
Module 2’s twice-run trap has its fix, measured on both sides. A lazy DataFrame keeps nothing between actions, so CityFlow’s zone-hour base — a window filter, hour truncation, group-by shuffle, and broadcast join over 9,554,778 rows — recomputed in full for each of three actions: count() 0.77 s, agg sum 1.09 s, top-5 1.05 s, 2.92 s of repeated work. One cache() call — equivalently persist(StorageLevel.MEMORY_AND_DISK) — changed that: cache() is itself lazy (is_cached True at once, materialized only on the first action), so the first count() ran slower at 1.42 s because it computed and stored the base, and the next two actions then read from memory in 0.31 s and 0.15 s, for 1.88 s total and a 1.56× win. The plan made the cache visible as InMemoryTableScan over an InMemoryRelation StorageLevel(disk, memory, deserialized), with the whole expensive subtree folded inside it and skipped on every read; the cached result still cross-checked to 240,917 buckets, 9,554,757 trips, and $256,692,373.14 to the cent. The honest cost was measured too: for a single action, cache saved nothing (0.23 s vs 0.22 s) while pinning memory for a copy read once, and persisting the raw 9.5M×19 frame threw OutOfMemoryError — MEMORY_AND_DISK builds column batches in the heap before it can spill, so “spills to disk” is no license to cache what doesn’t fit. The rule is short: cache when it is reused and it fits, choose a storage level to match, and unpersist() (or spark.catalog.clearCache()) the moment the reuse is done.
cache() / persist(StorageLevel...) — marks a DataFrame to be stored on first materialization; cache() is persist(MEMORY_AND_DISK). It is lazy (is_cached True immediately, materialized on the first action), turning N recomputes into one materialization plus N−1 memory reads — 2.92 s to 1.88 s, 1.56×, across three actions.InMemoryTableScan / InMemoryRelation — how a cache appears in explain(): a scan over a stored relation tagged with its StorageLevel, with the original pipeline folded inside and skipped on every read. Seeing it is proof the cache is in force.OutOfMemoryError for the raw 9.5M×19 frame.unpersist() / clearCache() / storage levels — unpersist() frees one cache, spark.catalog.clearCache() frees all; MEMORY_ONLY drops-and-recomputes overflow, MEMORY_AND_DISK spills it, DISK_ONLY skips RAM. Read df.storageLevel for what a DataFrame actually holds.Caching is the Spark lever most often reached for on reflex and most often misused in both directions. Engineers who never cache watch a notebook re-scan a quarter of data for every casual show(), exactly the twice-run trap paying full price cell after cell; engineers who cache everything pin gigabytes of RAM holding intermediates read once, then blame the cluster when the next stage OutOfMemoryErrors — the same crash this lesson triggered on purpose. The discipline that separates them is not a rule of thumb but a habit of measurement: find the fork in the pipeline where an expensive result feeds more than one action, confirm it fits, cache it there, and free it when its readers are done. That the win on one 160 MB laptop job is a modest 1.56× is itself the honest lesson — caching is not a magic accelerator, it is a specific trade of memory and one compute pass against repeated recomputation, and it pays exactly when reuse is real and the data fits. Get that judgment right and it scales: on a multi-terabyte job feeding a dozen downstream aggregations, the same cache() at the same fork is the difference between a pipeline that finishes and one that reads its source a dozen times over.
You’ve now measured the last of Module 5’s whole-job levers — how many partitions, narrow versus wide, and when to store instead of recompute. Lesson 4, Skew & Stragglers, drops from the job down to the single task, and to the reason a job that looks balanced on paper can still crawl. When the zone-hour shuffle hash-partitions on the pickup zone, JFK’s 429,745 trips and Midtown’s 453,825 don’t spread evenly — they pile into one partition, so one task processes far more rows than its nine neighbours and runs long after they’ve finished. The stage is only as fast as its slowest task, an echo of Course 1’s Amdahl limit, and you’ll diagnose the imbalance for real by counting rows per partition after a hash-partition on the hot key. Then the mitigations, measured and honest: what AQE’s skew-join handling already does for you on by default, what salting a hot key buys and costs, and when more parallelism helps. Caching stored a result so you’d stop recomputing it; skew handling is about making the one computation you can’t avoid finish on time.
Keep DATATWEETS free. Help fund practical data, AI, and engineering lessons for learners worldwide.
