Title here
Summary here
Create a reusable pandas data quality report from a fictional room-sensor dataset, then turn assumptions about IDs, categories, types, and ranges into explicit checks.

A CSV file can open without errors and still be unsafe to analyze. A sensor value may be missing. Two rows may share the same identifier. A room label may contain one invisible trailing space. A number column may even contain the word error.
These problems do not always stop Python. Instead, they can quietly change a total, split one group into two groups, or make a numeric column behave like text.
This tutorial builds a small data quality report with pandas. A data quality report is a table of checks that shows whether data follows the rules you expect. We will first examine what each column contains, then write rules for identifiers, categories, numeric values, and valid ranges. The result is a repeatable check you can run before analysis.
This lesson focuses on detection, not cleaning. If you want to decide how to repair the problems after finding them, continue with Cleaning Messy Data with pandas.
You need Python and basic experience running a script or notebook cell. You do not need previous knowledge of data validation.
Create an isolated environment and install pandas and Matplotlib:
python -m venv .venv
source .venv/bin/activate
python -m pip install pandas matplotlib
On Windows PowerShell, use .venv\Scripts\Activate.ps1 to activate the environment.
The published results use Python 3.13.2, pandas 3.0.3, and Matplotlib 3.11.0. Download room_sensor_readings.csv into your working folder.
The dataset contains fictional hourly readings for a laboratory, an office, and a storage room. It was generated with a fixed random seed and is released under CC0-1.0. You may reuse it without restriction. Its measurements and quality problems were created only for this lesson; they do not describe a real building.
Before checking the data, write down what a valid row means. This set of expectations is a data contract: an explicit description of the structure and values your data should contain. It does not require special software and can begin as plain language:
reading_id.room is exactly Lab, Office, or Storage.These rules come from the fictional system design. pandas cannot discover them from the file alone. For example, pandas can find the maximum temperature, but only a person who understands the data can decide whether 48.5°C is allowed.
Keep two layers separate:
profile: What values and types arrived?
checks:  Do those values follow our contract?
A profile helps you notice surprises. Contract checks turn known expectations into pass-or-fail results. You need both because a surprising value is not automatically wrong, and a common value is not automatically valid.
First, import pandas and load the file. We do not provide type instructions yet because we want to see what pandas infers from the raw CSV.
import pandas as pd

readings = pd.read_csv("room_sensor_readings.csv")

print(readings.head(4).to_string(index=False))
print("\nshape:", readings.shape)
reading_id recorded_at room temperature_c humidity_pct co2_ppm battery_pct
R1-01 2026-04-06T08:00:00 Lab 20.8 44.3 728 95
R1-02 2026-04-06T09:00:00 Lab 21.1 44.0 671 94
R1-03 2026-04-06T10:00:00 Lab 21.6 48.2 711 94
R1-04 2026-04-06T11:00:00 Lab 22.0 43.8 648 94
shape: (73, 7)There are 73 rows and 7 columns. The first four rows look reasonable, but that preview covers only a small part of the file. A quality check must examine every row.
Next, inspect the inferred data type of each column. A data type, often shortened to dtype, tells pandas whether values behave as numbers, text, dates, or another kind of data.
print(readings.dtypes.to_string())reading_id str
recorded_at str
room str
temperature_c float64
humidity_pct float64
co2_ppm str
battery_pct int64temperature_c and humidity_pct are decimal numbers. battery_pct is an integer. However, co2_ppm is text even though the preview showed numeric-looking values. That mismatch is a clue: at least one value may not be a valid number.
The exact text dtype shown by older pandas versions may be object instead of str. The important finding is the same: co2_ppm was not loaded as a numeric column.
Looking at seven dtypes separately is manageable, but a single table is easier to scan and reuse. The following function creates one row per column. It records the dtype, number of missing values, missing percentage, and number of distinct nonmissing values.
def profile_columns(data):
    return pd.DataFrame(
        {
            "dtype": data.dtypes.astype(str),
            "missing": data.isna().sum(),
            "missing_pct": (data.isna().mean() * 100).round(1),
            "unique": data.nunique(dropna=True),
        }
    )


profile = profile_columns(readings)
print(profile.to_string())
dtype missing missing_pct unique
reading_id str 0 0.0 72
recorded_at str 0 0.0 24
room str 0 0.0 4
temperature_c float64 0 0.0 44
humidity_pct float64 3 4.1 52
co2_ppm str 0 0.0 59
battery_pct int64 0 0.0 9Read this table across each row. humidity_pct is missing in 3 rows, or 4.1% of the file. There are 73 rows but only 72 unique reading IDs, so an ID may be repeated. The room column has 4 distinct labels even though the contract allows only 3.
nunique(dropna=True) does not count a missing value as a distinct value. This is why missing counts and unique counts appear in separate columns. The current pandas DataFrame.nunique documentation describes this dropna behavior.
The profile points to questions, but it does not identify the cause. We need focused checks next.
An ID is meant to identify one reading. To find every row involved in a duplicate, pass keep=False to duplicated(). Without that argument, pandas marks only later copies by default.
duplicate_id = readings["reading_id"].duplicated(keep=False)

print(readings.loc[duplicate_id, ["reading_id", "recorded_at", "room"]].to_string(index=False))
reading_id recorded_at room
R1-13 2026-04-06T20:00:00 Lab
R1-13 2026-04-06T20:00:00 LabTwo rows share R1-13. This does not yet tell us which row to remove. They might be accidental copies, or the ID rule might be wrong. Detection should preserve that uncertainty until you investigate the source system.
The profile also showed four room labels. Display the count for each exact label with value_counts():
print(readings["room"].value_counts(dropna=False).to_string())room
Lab 25
Storage 24
Office 23
Office 1The last two labels look identical in aligned output. One actually contains a trailing space. Instead of relying on visual inspection, compare every value with the allowed set from the contract:
allowed_rooms = {"Lab", "Office", "Storage"}
unexpected_room = ~readings["room"].isin(allowed_rooms)

print(readings.loc[unexpected_room, ["reading_id", "room"]].to_dict("records"))
[{'reading_id': 'R2-06', 'room': 'Office '}]This problem is category drift: a column that should use a fixed set of labels contains a value outside that set. pandas also offers a dedicated categorical dtype for representing such columns, as explained in the official categorical data guide.
The co2_ppm dtype suggested a bad value. Use pd.to_numeric() with errors="coerce" to test conversion. Coercion replaces values that cannot become numbers with NaN, pandas’ missing numeric marker. Keep the original column unchanged so you can inspect the bad input.
co2_numeric = pd.to_numeric(readings["co2_ppm"], errors="coerce")
invalid_co2 = co2_numeric.isna()

print(readings.loc[invalid_co2, ["reading_id", "co2_ppm"]].to_string(index=False))
reading_id co2_ppm
R2-19 errorThe conversion test finds one invalid value. Do not call .fillna(0) automatically: zero parts per million is a real number with a very different meaning from “the sensor did not return a number.”
For numeric range rules, between() produces True for values inside an inclusive interval. Negate it with ~ to find failures. The extra notna() condition keeps missing values in the missing-value check instead of counting them again as range failures.
bad_temperature = (
    ~readings["temperature_c"].between(-10, 45)
    & readings["temperature_c"].notna()
)
bad_humidity = (
    ~readings["humidity_pct"].between(0, 100)
    & readings["humidity_pct"].notna()
)

print(readings.loc[bad_temperature, ["reading_id", "temperature_c"]].to_string(index=False))
print(readings.loc[bad_humidity, ["reading_id", "humidity_pct"]].to_string(index=False))
reading_id temperature_c
R1-19 48.5
reading_id humidity_pct
R3-03 108.0The file contains one temperature above the contract limit and one humidity value above 100%. These may be sensor faults, unit mistakes, or genuine conditions outside an overly narrow temperature rule. A failed check is a request to investigate, not permission to silently delete a row.
Now collect the checks in a named Series. Each number counts failures for one rule. Most rules count failed rows; the missing-values rule counts missing cells across the two required columns. This makes the report easy to print, save, plot, or compare between file deliveries.
checks = pd.Series(
    {
        "Missing required values": int(
            readings[["temperature_c", "humidity_pct"]].isna().sum().sum()
        ),
        "Duplicate reading IDs": int(duplicate_id.sum()),
        "Unexpected room labels": int(unexpected_room.sum()),
        "Invalid CO2 numbers": int(invalid_co2.sum()),
        "Temperature out of range": int(bad_temperature.sum()),
        "Humidity out of range": int(bad_humidity.sum()),
    },
    name="failures",
)

print(checks.to_string())
Missing required values 3
Duplicate reading IDs 2
Unexpected room labels 1
Invalid CO2 numbers 1
Temperature out of range 1
Humidity out of range 1The largest count is three missing required values. The duplicate count is two because both rows with the repeated ID are marked. Each of the other four checks finds one row.
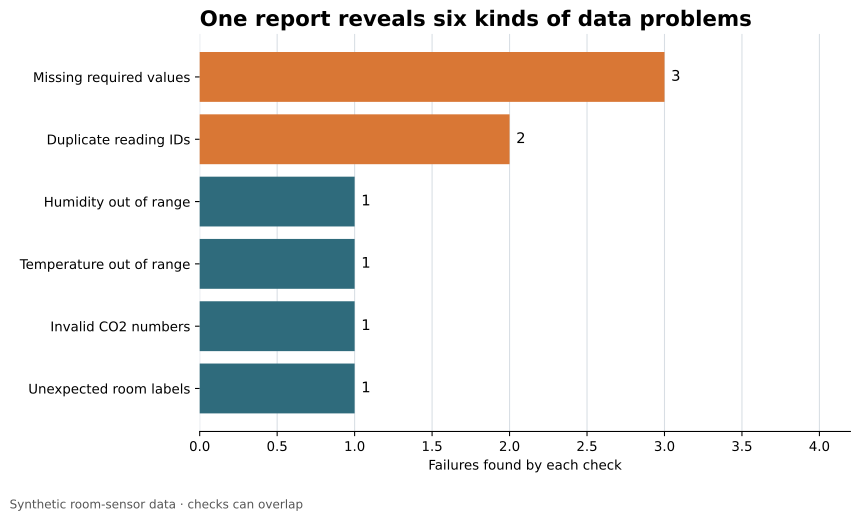
Do not add these values and call the result “nine bad rows.” One row can fail several rules, and one row can have more than one missing required value, so the counts may overlap. To find the exact number of affected rows, first create a row-level missing-value mask with .any(axis=1). Then combine all row-level Boolean masks with |, which means OR:
missing_required = readings[["temperature_c", "humidity_pct"]].isna().any(axis=1)

any_failure = (
    missing_required
    | duplicate_id
    | unexpected_room
    | invalid_co2
    | bad_temperature
    | bad_humidity
)

print("rows with any failure:", int(any_failure.sum()))
rows with any failure: 9This dataset happens to have nine affected rows because its failures do not overlap. The mask computes that result correctly even when future files contain overlapping failures.
In an automated workflow, you can stop processing when critical checks fail:
assert checks["Duplicate reading IDs"] == 0, "reading_id must be unique"
assert checks["Invalid CO2 numbers"] == 0, "co2_ppm must be numeric"
If you run these assertions on the tutorial dataset, the first call to assert stops execution because duplicate IDs exist. In a production pipeline, use clear exceptions or a validation library when you need to evaluate every rule and produce a richer report. The important step is to make each rule executable instead of leaving it as an assumption in someone’s memory.
.describe() as a complete quality checkNumeric summary statistics are useful, but they do not enforce unique IDs or allowed labels. A complete first pass includes structure, missingness, uniqueness, categories, conversion, and domain-specific ranges.
readings["reading_id"].duplicated() uses keep="first" by default. It marks the second copy but not the first. Use keep=False when you want every involved row for investigation.
Calling .str.strip() immediately would merge Office into Office, but it would also hide evidence about the incoming file. Detect and record the unexpected value first. Then clean it in a separate, explicit step.
Zero and missing have different meanings. Use errors="coerce" to identify invalid input, decide how it should be handled, and retain a count of affected rows.
The limits in this lesson belong to a fictional room-sensor contract. Do not copy them into a medical, industrial, or outdoor dataset. Ask the data owner what is physically possible and what the system is designed to accept.
A row can have a missing measurement and an unexpected category at the same time. Keep row-level masks and combine them when you need the number of affected rows.
A reliable first pass has two parts. The profile tells you what arrived: types, missing values, and distinct counts. The contract tells you what should have arrived: unique IDs, fixed labels, numeric fields, and sensible ranges.
The reusable workflow is:
The durable idea is simple: pandas can summarize a file, but your data contract gives the summary meaning. Once assumptions become code, quality checks become repeatable instead of depending on careful manual inspection.
 Python
Build an AI Chatbot in Python: A Command-Line LLM Client
A from-scratch walkthrough of the pattern behind every LLM chatbot: one function that sends a message plus conversation history to a chat-completion API, a persona set by a system prompt, and a loop that keeps the conversation going.
Read tutorial
Python
Build an AI Chatbot in Python: A Command-Line LLM Client
A from-scratch walkthrough of the pattern behind every LLM chatbot: one function that sends a message plus conversation history to a chat-completion API, a persona set by a system prompt, and a loop that keeps the conversation going.
Read tutorial
 Software Engineering
The Single Responsibility Principle: One Class, One Reason to Change
The Single Responsibility Principle says a class should have only one reason to change. See it in action: take a Python AuthService that also owns its logging, find why that's a problem, and refactor it into clean, focused classes.
Read tutorial
Software Engineering
The Single Responsibility Principle: One Class, One Reason to Change
The Single Responsibility Principle says a class should have only one reason to change. See it in action: take a Python AuthService that also owns its logging, find why that's a problem, and refactor it into clean, focused classes.
Read tutorial